
- Home >
- Stock Photos >
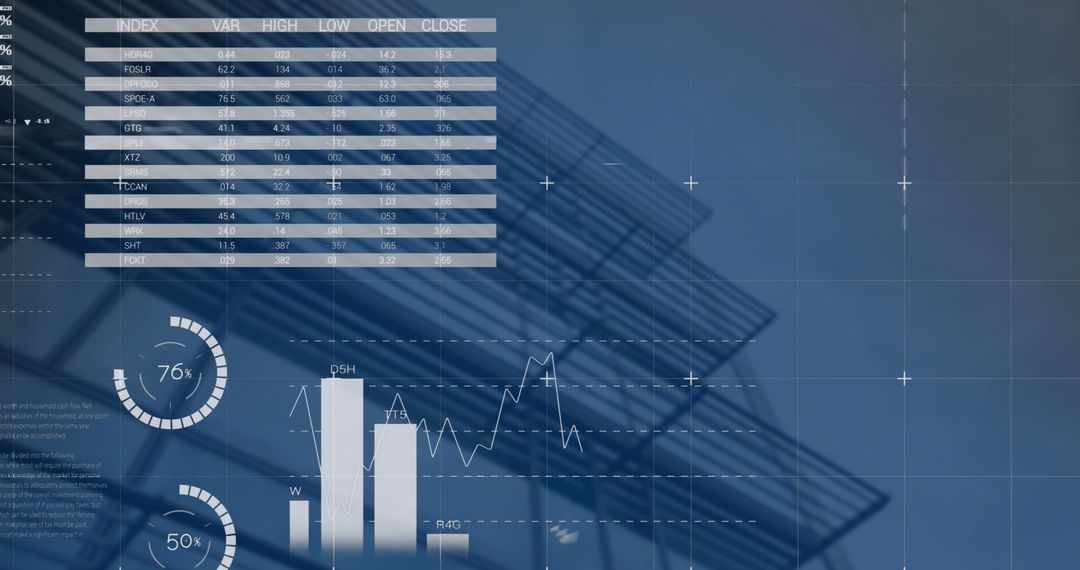
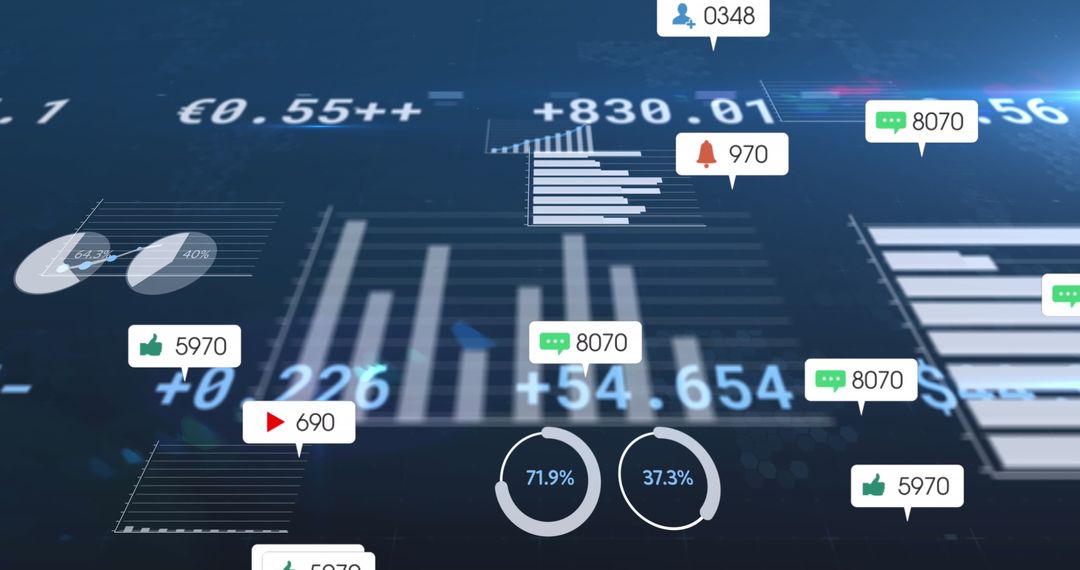
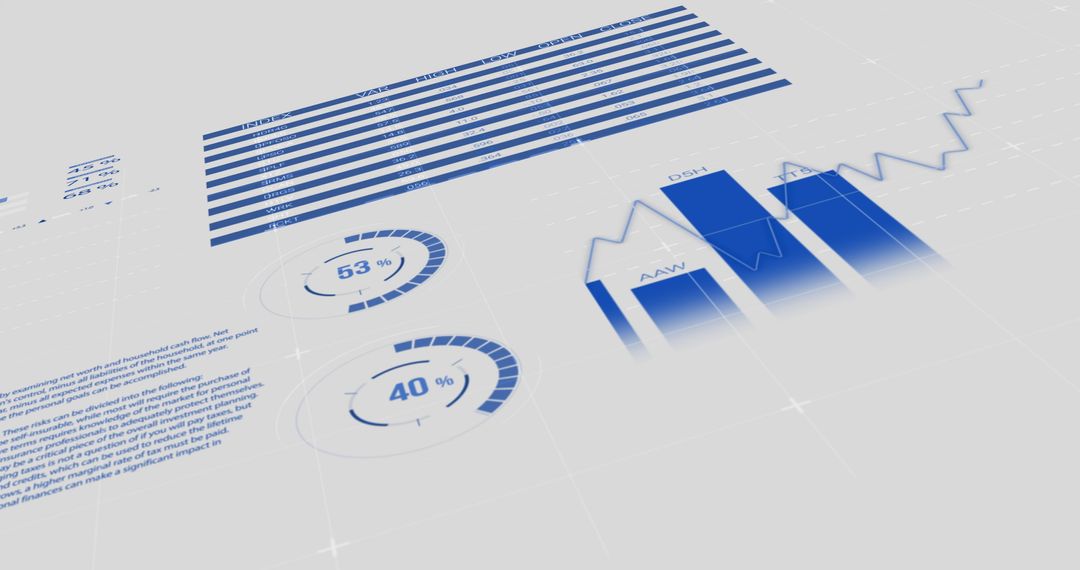
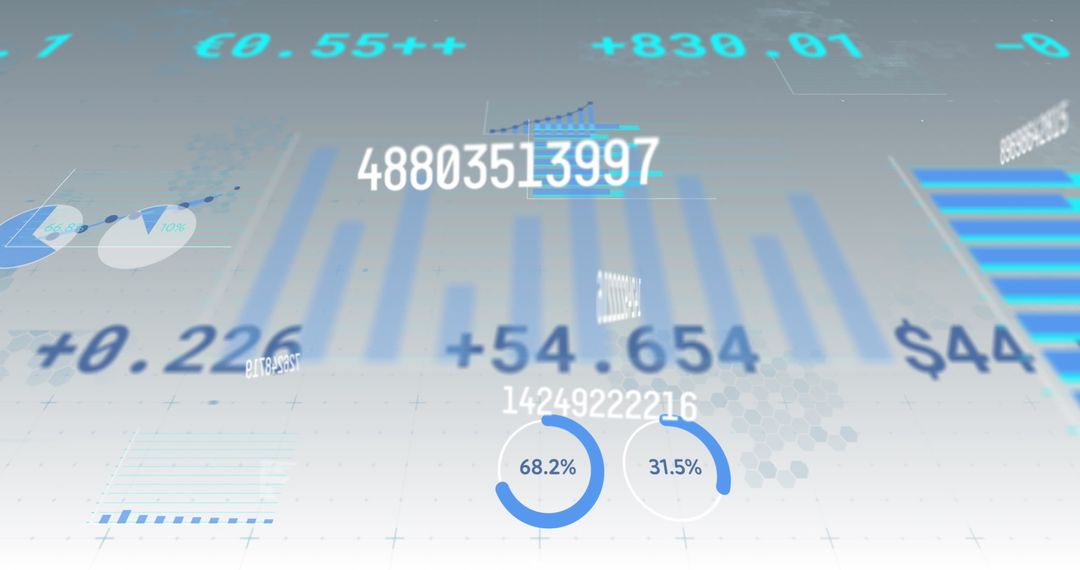
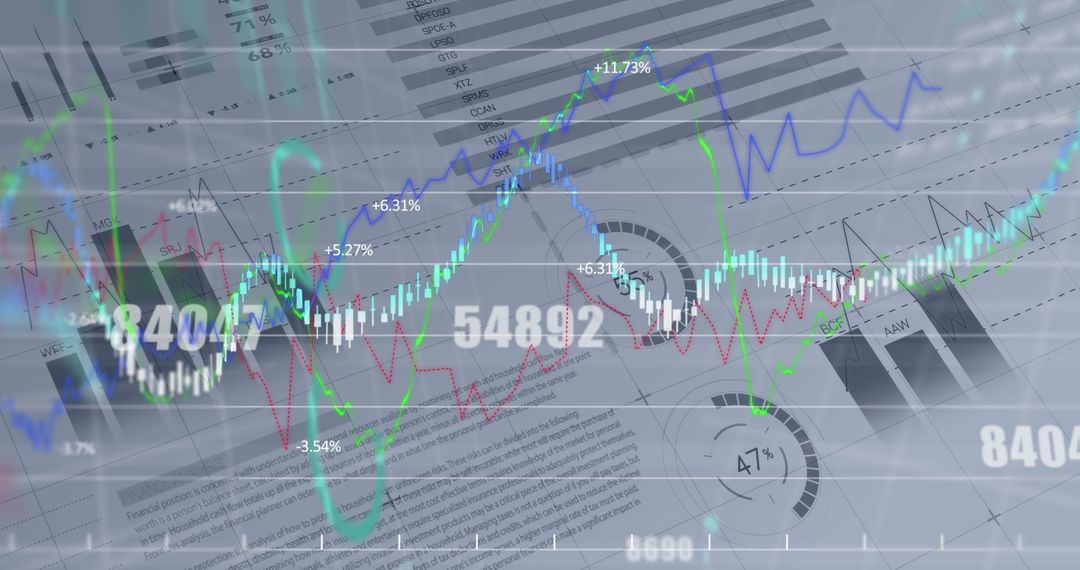
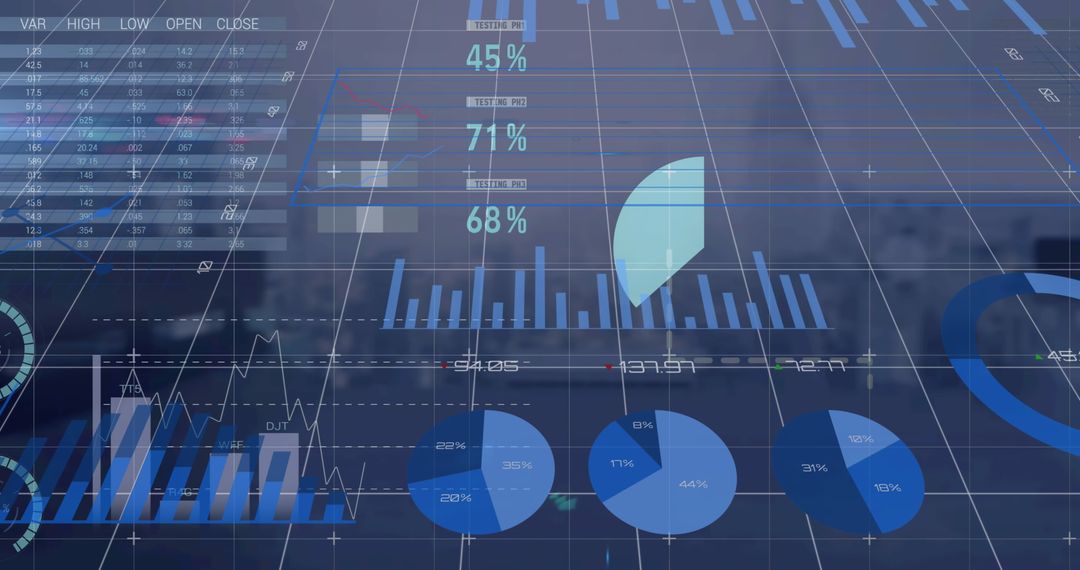
- Dynamic Financial Data and Statistical Analysis in Digital Space
Dynamic Financial Data and Statistical Analysis in Digital Space Image

Visual illustrating continuously changing financial numbers and statistics offers insights into real-time data processing. Bright digital graphs and charts in a dark, futuristic color palette make this suitable for presentations on global finance, stock market analysis, and business intelligence.
Powered by  - Get 15% off with code: PIKWIZARD15


2
downloads
downloads
Tags:
More
Credit Photo
If you would like to credit the Photo, here are some ways you can do so
Text Link
photo Link
<span class="text-link">
<span>
<a target="_blank" href=https://pikwizard.com/photo/dynamic-financial-data-and-statistical-analysis-in-digital-space/04094880a102eb4147d4256a437f2125/>PikWizard</a>
</span>
</span>
<span class="image-link">
<span
style="margin: 0 0 20px 0; display: inline-block; vertical-align: middle; width: 100%;"
>
<a
target="_blank"
href="https://pikwizard.com/photo/dynamic-financial-data-and-statistical-analysis-in-digital-space/04094880a102eb4147d4256a437f2125/"
style="text-decoration: none; font-size: 10px; margin: 0;"
>
<img src="https://pikwizard.com/pw/medium/04094880a102eb4147d4256a437f2125.jpg" style="margin: 0; width: 100%;" alt="" />
<p style="font-size: 12px; margin: 0;">PikWizard</p>
</a>
</span>
</span>
Free (free of charge)
Free for personal and commercial use.
Author: People Creations
Similar Free Stock Images
Premium


Premium


Premium


Premium


Premium


Premium


Premium


Premium


Premium


Premium


Premium


Premium


Premium


Premium


Premium


Premium


Premium


Premium


Premium


Premium


Premium


Premium


Premium


Premium

