- Home >
- Stock Photos >
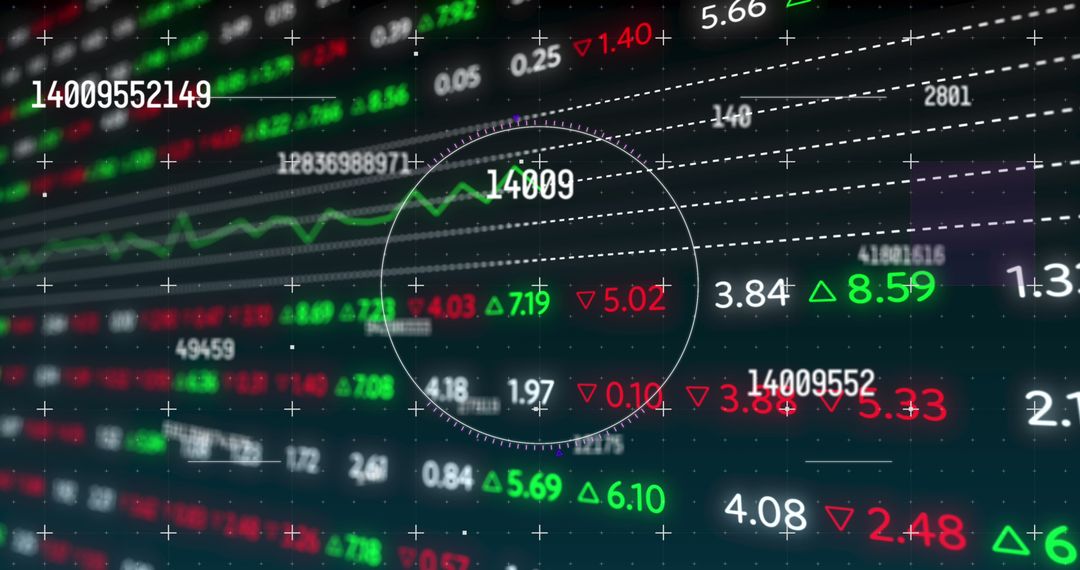
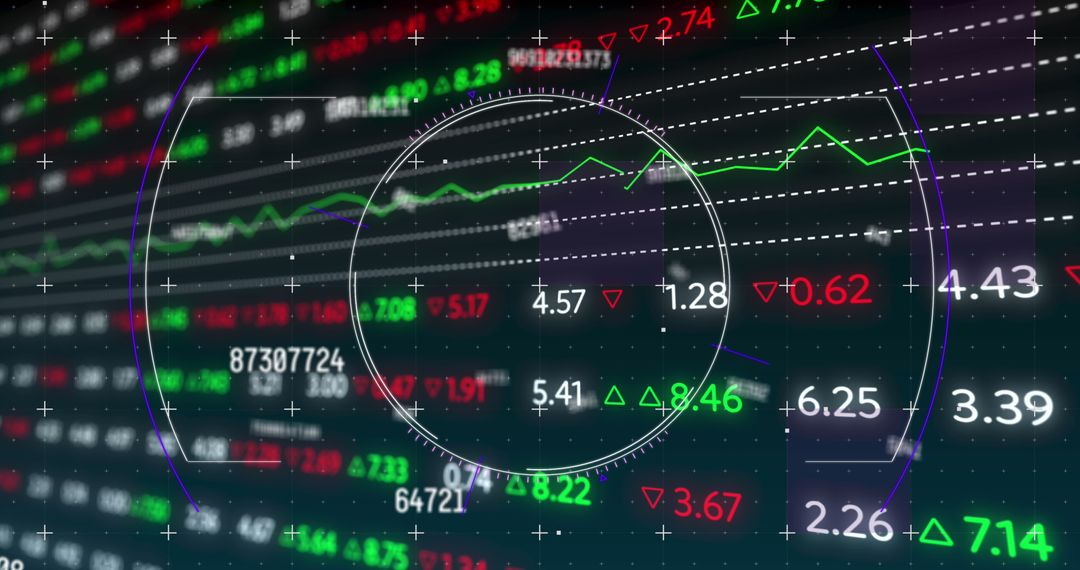
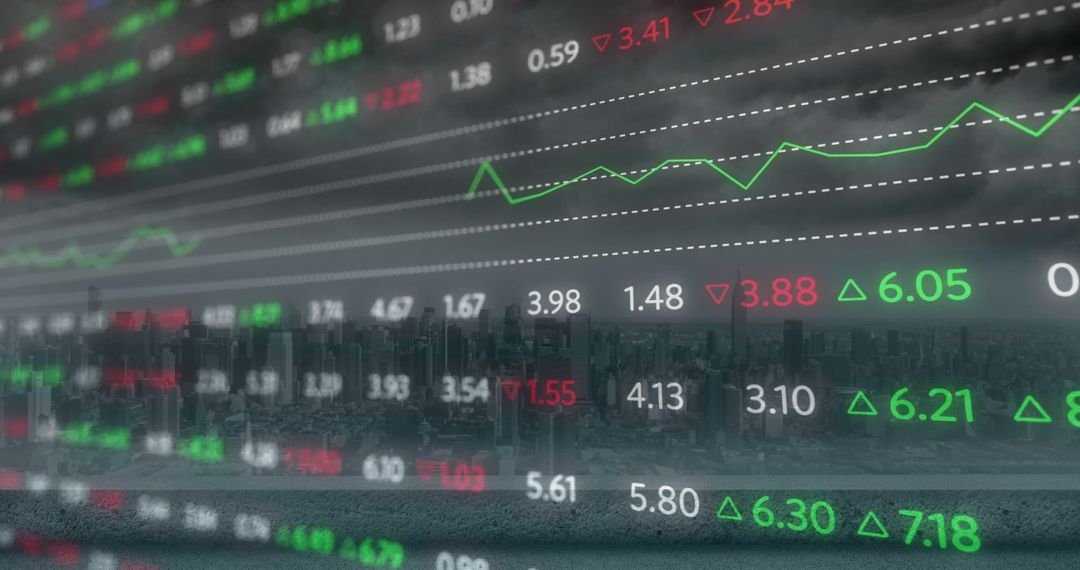
- Dynamic Financial Data and Stock Market Analysis Display
Dynamic Financial Data and Stock Market Analysis Display Image

Vibrant display of fluctuating stock market data showcasing green and red numerical indicators and chart lines. Useful for topics related to financial analysis, business strategy, investment planning, and economic monitoring. Ideal for educational and professional presentations, financial dashboards, or marketing materials in the finance sector.
Powered by  - Get 15% off with code: PIKWIZARD15


2
downloads
downloads
Tags:
More
Credit Photo
If you would like to credit the Photo, here are some ways you can do so
Text Link
photo Link
<span class="text-link">
<span>
<a target="_blank" href=https://pikwizard.com/photo/dynamic-financial-data-and-stock-market-analysis-display/03ed0a4c8c5bb83485585612f8863510/>PikWizard</a>
</span>
</span>
<span class="image-link">
<span
style="margin: 0 0 20px 0; display: inline-block; vertical-align: middle; width: 100%;"
>
<a
target="_blank"
href="https://pikwizard.com/photo/dynamic-financial-data-and-stock-market-analysis-display/03ed0a4c8c5bb83485585612f8863510/"
style="text-decoration: none; font-size: 10px; margin: 0;"
>
<img src="https://pikwizard.com/pw/medium/03ed0a4c8c5bb83485585612f8863510.jpg" style="margin: 0; width: 100%;" alt="" />
<p style="font-size: 12px; margin: 0;">PikWizard</p>
</a>
</span>
</span>
Free (free of charge)
Free for personal and commercial use.
Author: Creative Art
Similar Free Stock Images

Premium


Premium


Premium


Premium


Premium


Premium


Premium


Premium


Premium


Premium


Premium


Premium


Premium


Premium


Premium


Premium


Premium


Premium


Premium


Premium


Premium


Premium


Premium


Premium