- Home >
- Stock Photos >
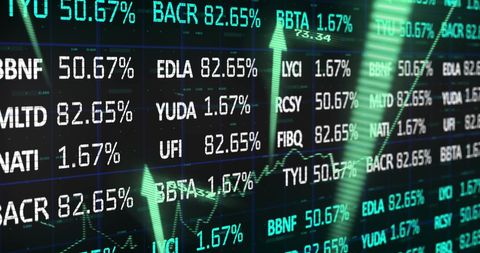
- Dynamic Financial Data and Stock Market Analysis
Dynamic Financial Data and Stock Market Analysis Image

Complex visual data displaying fluctuating stock information includes key elements such as charts and color-coded trends. Ideal for use in educational content about trading, financial services, technology-focused articles, or presentations on global market analysis and investment strategies.
Powered by  - Get 15% off with code: PIKWIZARD15


2
downloads
downloads
Tags:
More
Credit Photo
If you would like to credit the Photo, here are some ways you can do so
Text Link
photo Link
<span class="text-link">
<span>
<a target="_blank" href=https://pikwizard.com/photo/dynamic-financial-data-and-stock-market-analysis/35d5cf5b97232e06ab807ac617a4c68b/>PikWizard</a>
</span>
</span>
<span class="image-link">
<span
style="margin: 0 0 20px 0; display: inline-block; vertical-align: middle; width: 100%;"
>
<a
target="_blank"
href="https://pikwizard.com/photo/dynamic-financial-data-and-stock-market-analysis/35d5cf5b97232e06ab807ac617a4c68b/"
style="text-decoration: none; font-size: 10px; margin: 0;"
>
<img src="https://pikwizard.com/pw/medium/35d5cf5b97232e06ab807ac617a4c68b.jpg" style="margin: 0; width: 100%;" alt="" />
<p style="font-size: 12px; margin: 0;">PikWizard</p>
</a>
</span>
</span>
Free (free of charge)
Free for personal and commercial use.
Author: Awesome Content
Similar Free Stock Images
Loading...

Premium


Premium


Premium


Premium

Premium


Premium


Premium


Premium

Premium


Premium

Premium


Premium


Premium


Premium

Premium


Premium

Premium


Premium


Premium


Premium


Premium

Premium


Premium


Premium

Premium