- Home >
- Stock Photos >
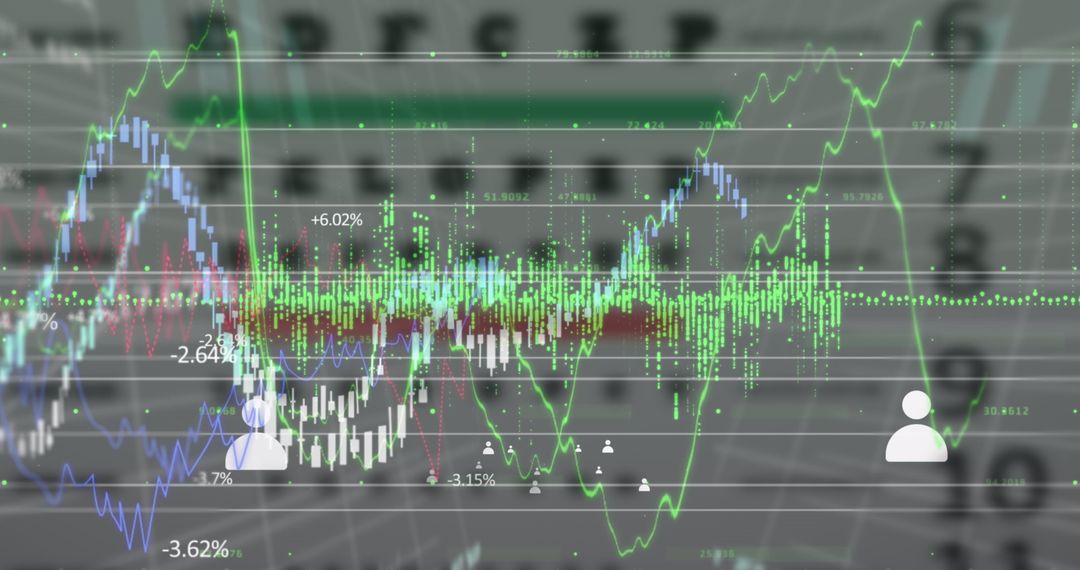
- Dynamic Financial Data and Stock Market Interface
Dynamic Financial Data and Stock Market Interface Image

Depicting real-time stock market data, this image illustrates fluctuating numbers and graph lines, representing financial markets at work. Useful for illustrating articles, presentations, or studies related to financial markets, stocks, investment strategies, and technology in finance.
Powered by 


3
downloads
downloads
Tags:
More
Credit Photo
If you would like to credit the Photo, here are some ways you can do so
Text Link
photo Link
<span class="text-link">
<span>
<a target="_blank" href=https://pikwizard.com/photo/dynamic-financial-data-and-stock-market-interface/3cf1042f64ecf6b023cb694e8dcdd6d8/>PikWizard</a>
</span>
</span>
<span class="image-link">
<span
style="margin: 0 0 20px 0; display: inline-block; vertical-align: middle; width: 100%;"
>
<a
target="_blank"
href="https://pikwizard.com/photo/dynamic-financial-data-and-stock-market-interface/3cf1042f64ecf6b023cb694e8dcdd6d8/"
style="text-decoration: none; font-size: 10px; margin: 0;"
>
<img src="https://pikwizard.com/pw/medium/3cf1042f64ecf6b023cb694e8dcdd6d8.jpg" style="margin: 0; width: 100%;" alt="" />
<p style="font-size: 12px; margin: 0;">PikWizard</p>
</a>
</span>
</span>
Free (free of charge)
Free for personal and commercial use.
Author: Creative Art
Similar Free Stock Images

Premium


Premium


Premium


Premium


Premium


Premium


Premium


Premium


Premium


Premium


Premium


Premium


Premium


Premium


Premium


Premium


Premium


Premium


Premium


Premium


Premium


Premium


Premium


Premium