
- Home >
- Stock Photos >
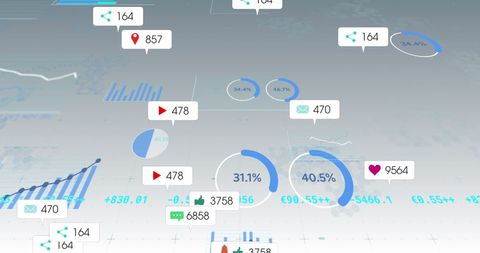
- Dynamic Financial Data Background with Changing Statistics
Dynamic Financial Data Background with Changing Statistics Image

Illustrates complex and dynamic financial and statistical data processing using digital technology. Ideal for use in business and finance presentations or for illustrating data analysis and digital interfaces in reports and articles focused on technology and quantitative research.
Powered by 


downloads
Tags:
More
Credit Photo
If you would like to credit the Photo, here are some ways you can do so
Text Link
photo Link
<span class="text-link">
<span>
<a target="_blank" href=https://pikwizard.com/photo/dynamic-financial-data-background-with-changing-statistics/5ff963f650e75322d5213cf5a1b34064/>PikWizard</a>
</span>
</span>
<span class="image-link">
<span
style="margin: 0 0 20px 0; display: inline-block; vertical-align: middle; width: 100%;"
>
<a
target="_blank"
href="https://pikwizard.com/photo/dynamic-financial-data-background-with-changing-statistics/5ff963f650e75322d5213cf5a1b34064/"
style="text-decoration: none; font-size: 10px; margin: 0;"
>
<img src="https://pikwizard.com/pw/medium/5ff963f650e75322d5213cf5a1b34064.jpg" style="margin: 0; width: 100%;" alt="" />
<p style="font-size: 12px; margin: 0;">PikWizard</p>
</a>
</span>
</span>
Free (free of charge)
Free for personal and commercial use.
Author: Creative Art
Similar Free Stock Images
Premium


Premium


Premium


Premium

Premium


Premium


Premium

Premium


Premium


Premium


Premium


Premium


Premium

Premium


Premium


Premium

Premium


Premium


Premium


Premium


Premium


Premium


Premium


Premium


Premium


Explore More Free Stock Images