
- Home >
- Stock Photos >
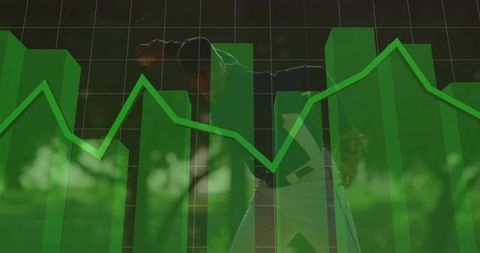
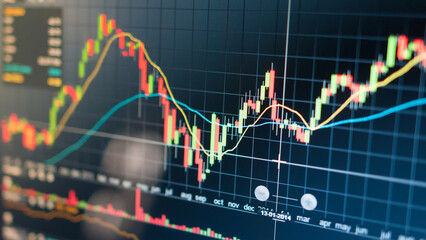
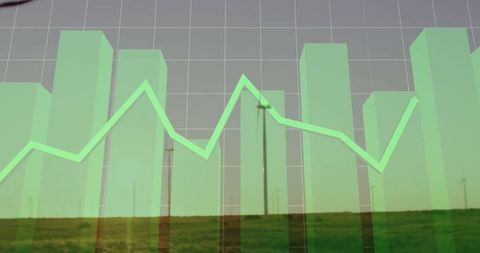
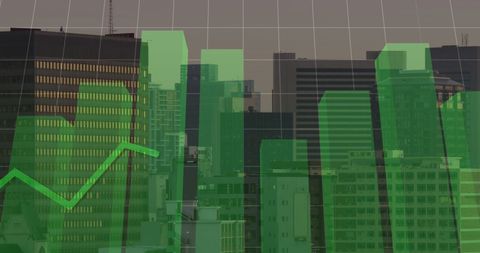
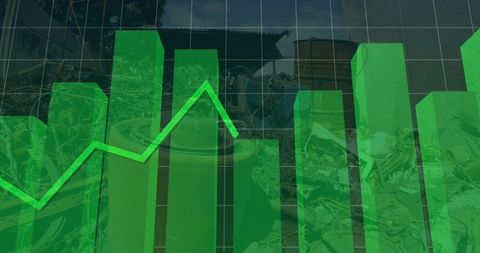
- Dynamic Financial Data Chart on Digital Network Background
Dynamic Financial Data Chart on Digital Network Background Image

Captivating portrayal of financial data processing graph set against a network of connections. Ideal for representing concepts like global technology, digital economy, and business analytics. This visualization suits presentations, finance-related website imagery, and materials exploring advancements in computerized data analysis efficient dynamics.
Powered by 


downloads
Tags:
More
Credit Photo
If you would like to credit the Photo, here are some ways you can do so
Text Link
photo Link
<span class="text-link">
<span>
<a target="_blank" href=https://pikwizard.com/photo/dynamic-financial-data-chart-on-digital-network-background/7b9b9407a051a7b79274995af08e7c1e/>PikWizard</a>
</span>
</span>
<span class="image-link">
<span
style="margin: 0 0 20px 0; display: inline-block; vertical-align: middle; width: 100%;"
>
<a
target="_blank"
href="https://pikwizard.com/photo/dynamic-financial-data-chart-on-digital-network-background/7b9b9407a051a7b79274995af08e7c1e/"
style="text-decoration: none; font-size: 10px; margin: 0;"
>
<img src="https://pikwizard.com/pw/medium/7b9b9407a051a7b79274995af08e7c1e.jpg" style="margin: 0; width: 100%;" alt="" />
<p style="font-size: 12px; margin: 0;">PikWizard</p>
</a>
</span>
</span>
Free (free of charge)
Free for personal and commercial use.
Author: Awesome Content
Similar Free Stock Images
Premium


Premium


Premium


Premium


Premium


Premium


Premium

Premium


Premium


Premium


Premium


Premium


Premium


Premium

Premium


Premium


Premium


Premium


Premium


Premium


Premium

Premium


Premium

Premium


Premium


Explore More Free Stock Images