
- Home >
- Stock Photos >
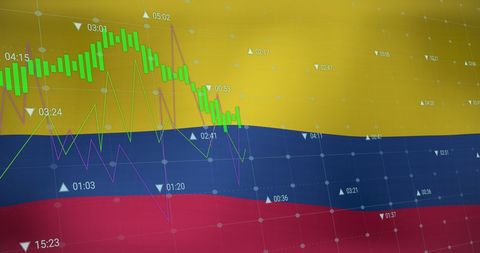
- Dynamic Financial Data Chart on Green Gradient Background
Dynamic Financial Data Chart on Green Gradient Background Image

Visual displays a vibrant and dynamic chart on a green gradient background, highlighting financial data trends and analytics. Suitable for use in financial reports, presentations, technology-related graphics, or business technology content to visually represent economic trends or analysis. Perfect for illustrating digital data and market predictions, combining modern design with precise data visualization.
Powered by 


downloads
Tags:
More
Credit Photo
If you would like to credit the Photo, here are some ways you can do so
Text Link
photo Link
<span class="text-link">
<span>
<a target="_blank" href=https://pikwizard.com/photo/dynamic-financial-data-chart-on-green-gradient-background/2a8ef4fc0701713f1a0cfcf6edb254a9/>PikWizard</a>
</span>
</span>
<span class="image-link">
<span
style="margin: 0 0 20px 0; display: inline-block; vertical-align: middle; width: 100%;"
>
<a
target="_blank"
href="https://pikwizard.com/photo/dynamic-financial-data-chart-on-green-gradient-background/2a8ef4fc0701713f1a0cfcf6edb254a9/"
style="text-decoration: none; font-size: 10px; margin: 0;"
>
<img src="https://pikwizard.com/pw/medium/2a8ef4fc0701713f1a0cfcf6edb254a9.jpg" style="margin: 0; width: 100%;" alt="" />
<p style="font-size: 12px; margin: 0;">PikWizard</p>
</a>
</span>
</span>
Free (free of charge)
Free for personal and commercial use.
Author: Awesome Content
Similar Free Stock Images

Premium


Premium


Premium


AI


Premium


Premium

Premium

AI


Premium

Premium


Premium


Premium


Premium


Premium


Premium

Premium

Premium


Premium


Premium

Premium


Premium


Premium


Premium


Premium


Premium

Premium


Premium


Explore More Free Stock Images