
- Home >
- Stock Photos >
- Dynamic Financial Data Chart Visualization in Black Background
Dynamic Financial Data Chart Visualization in Black Background Image
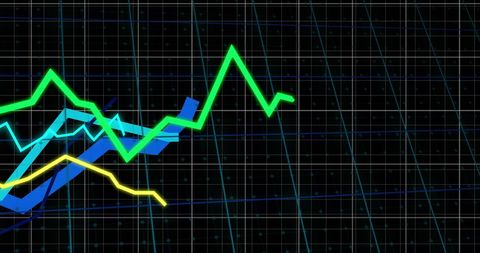
This graphic showcases a dynamic visualization of financial data with bright, colorful lines on a black background, representing fluctuating information across a chart. Ideal for presentations, business reports, and articles discussing financial technology, data processing, or global economics. Can be used as a stock photo or as a background for showcases related to finance and analytics.
Powered by  - Get 15% off with code: PIKWIZARD15


Credit Photo
If you would like to credit the Photo, here are some ways you can do so
Text Link
photo Link
<span class="text-link">
<span>
<a target="_blank" href=https://pikwizard.com/photo/dynamic-financial-data-chart-visualization-in-black-background/010c97a1cdd27eb321696193883bcd15/>PikWizard</a>
</span>
</span>
<span class="image-link">
<span
style="margin: 0 0 20px 0; display: inline-block; vertical-align: middle; width: 100%;"
>
<a
target="_blank"
href="https://pikwizard.com/photo/dynamic-financial-data-chart-visualization-in-black-background/010c97a1cdd27eb321696193883bcd15/"
style="text-decoration: none; font-size: 10px; margin: 0;"
>
<img src="https://pikwizard.com/pw/medium/010c97a1cdd27eb321696193883bcd15.jpg" style="margin: 0; width: 100%;" alt="" />
<p style="font-size: 12px; margin: 0;">PikWizard</p>
</a>
</span>
</span>
Free (free of charge)
Free for personal and commercial use.
Author: People Creations
Similar Free Stock Images

Premium


Premium

Premium


Premium


Premium


Premium


Premium

Premium


Premium


Premium
Premium

Premium


Premium


Premium


Premium

Premium


Premium

Premium


Premium


Premium


Premium


Premium


Premium


Premium


Premium


Explore More Free Stock Images