
- Home >
- Stock Photos >
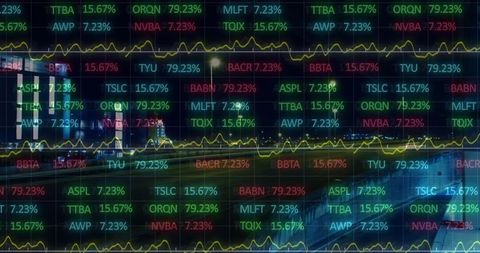
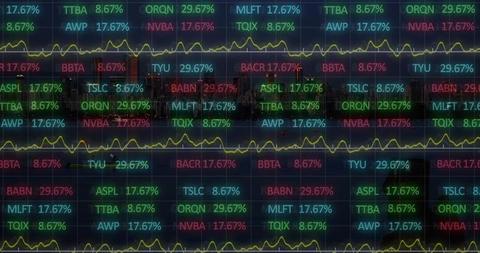
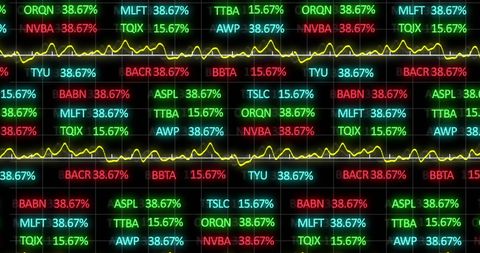
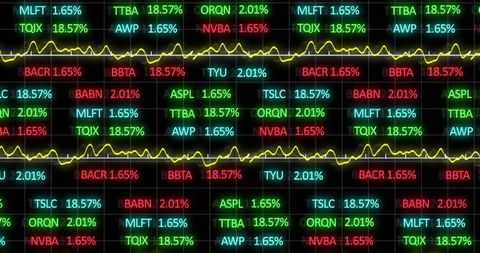
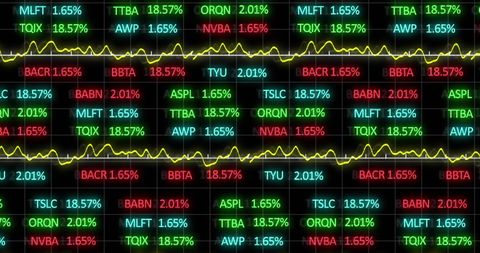
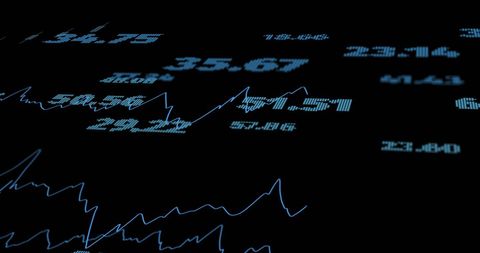
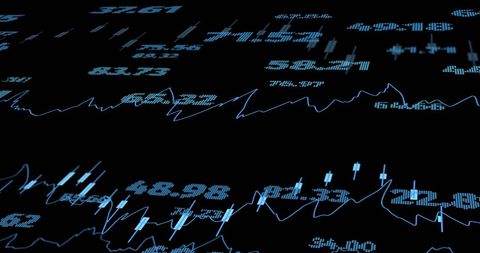
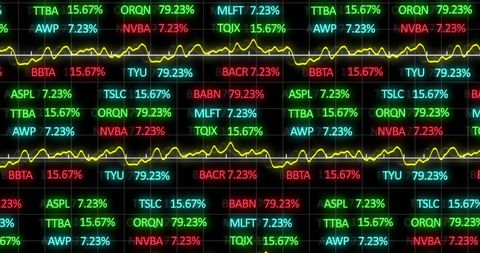
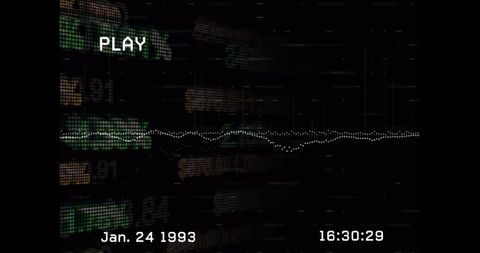
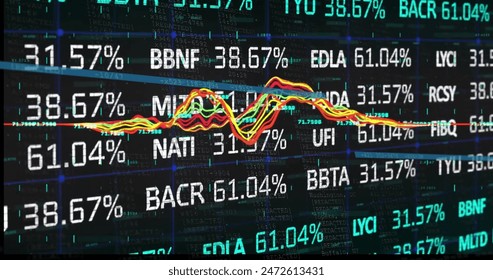
- Dynamic Financial Data Chart with Floating Numbers
Dynamic Financial Data Chart with Floating Numbers Image
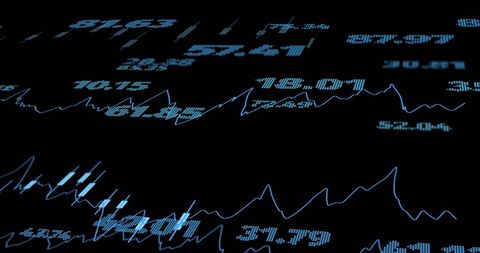
Electronic display featuring fluctuating financial numbers, ideal for illustrating trends in stock markets or economic analysis. Useful for articles, presentations, and content on financial markets or digital data analysis.
Powered by  - Get 15% off with code: PIKWIZARD15


downloads
Tags:
More
Credit Photo
If you would like to credit the Photo, here are some ways you can do so
Text Link
photo Link
<span class="text-link">
<span>
<a target="_blank" href=https://pikwizard.com/photo/dynamic-financial-data-chart-with-floating-numbers/1aa9a3af5f07275bb213167964ea5403/>PikWizard</a>
</span>
</span>
<span class="image-link">
<span
style="margin: 0 0 20px 0; display: inline-block; vertical-align: middle; width: 100%;"
>
<a
target="_blank"
href="https://pikwizard.com/photo/dynamic-financial-data-chart-with-floating-numbers/1aa9a3af5f07275bb213167964ea5403/"
style="text-decoration: none; font-size: 10px; margin: 0;"
>
<img src="https://pikwizard.com/pw/medium/1aa9a3af5f07275bb213167964ea5403.jpg" style="margin: 0; width: 100%;" alt="" />
<p style="font-size: 12px; margin: 0;">PikWizard</p>
</a>
</span>
</span>
Free (free of charge)
Free for personal and commercial use.
Author: Awesome Content
Similar Free Stock Images

Premium

Premium

Premium


Premium


Premium


Premium


Premium


Premium

Premium

Premium

Premium


Premium


Premium


Premium


Premium


Premium


Premium


Premium


Premium


Premium


Premium

Premium


Premium


Premium


Premium


Explore More Free Stock Images