
- Home >
- Stock Photos >
- Dynamic Financial Data Chart with Green Red Candlesticks and Trend Lines
Dynamic Financial Data Chart with Green Red Candlesticks and Trend Lines Image
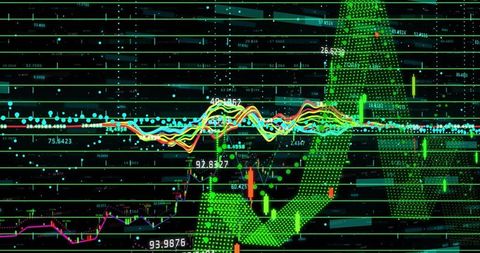
Visualizing complex financial data allows for better understanding of market trends and investment opportunities. Ideal for presentations on economic forecasting, investment strategies, stock market dynamics, and business intelligence platforms. Perfect for use in articles discussing market fluctuations and financial projections.
Powered by 


0
downloads
downloads
Tags:
More
Credit Photo
If you would like to credit the Photo, here are some ways you can do so
Text Link
photo Link
<span class="text-link">
<span>
<a target="_blank" href=https://pikwizard.com/photo/dynamic-financial-data-chart-with-green-red-candlesticks-and-trend-lines/725bb81ccc0d0f6ea65528ee45233c72/>PikWizard</a>
</span>
</span>
<span class="image-link">
<span
style="margin: 0 0 20px 0; display: inline-block; vertical-align: middle; width: 100%;"
>
<a
target="_blank"
href="https://pikwizard.com/photo/dynamic-financial-data-chart-with-green-red-candlesticks-and-trend-lines/725bb81ccc0d0f6ea65528ee45233c72/"
style="text-decoration: none; font-size: 10px; margin: 0;"
>
<img src="https://pikwizard.com/pw/medium/725bb81ccc0d0f6ea65528ee45233c72.jpg" style="margin: 0; width: 100%;" alt="" />
<p style="font-size: 12px; margin: 0;">PikWizard</p>
</a>
</span>
</span>
Free (free of charge)
Free for personal and commercial use.
Author: Awesome Content