- Home >
- Stock Photos >
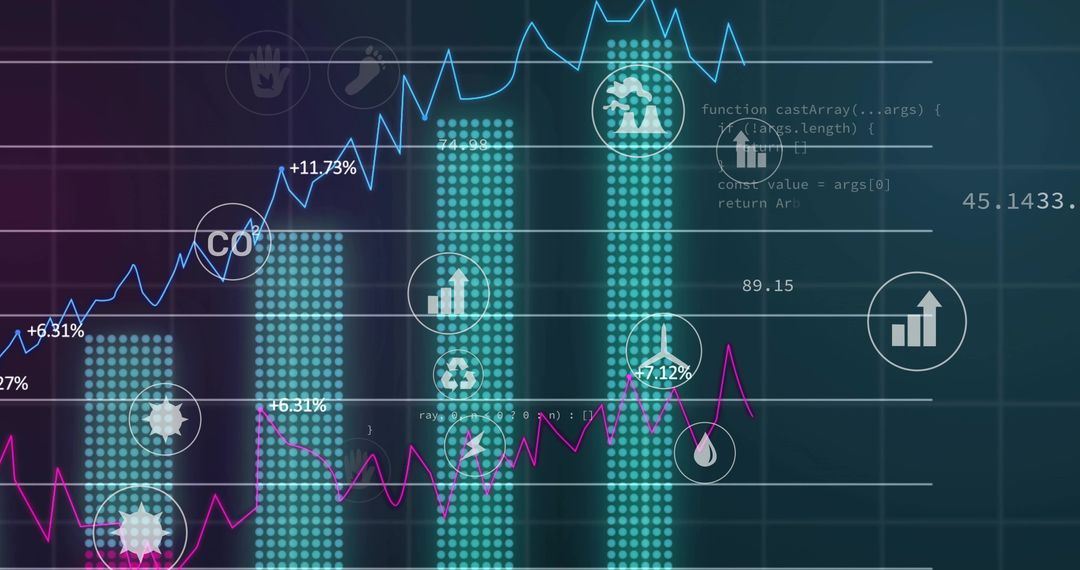
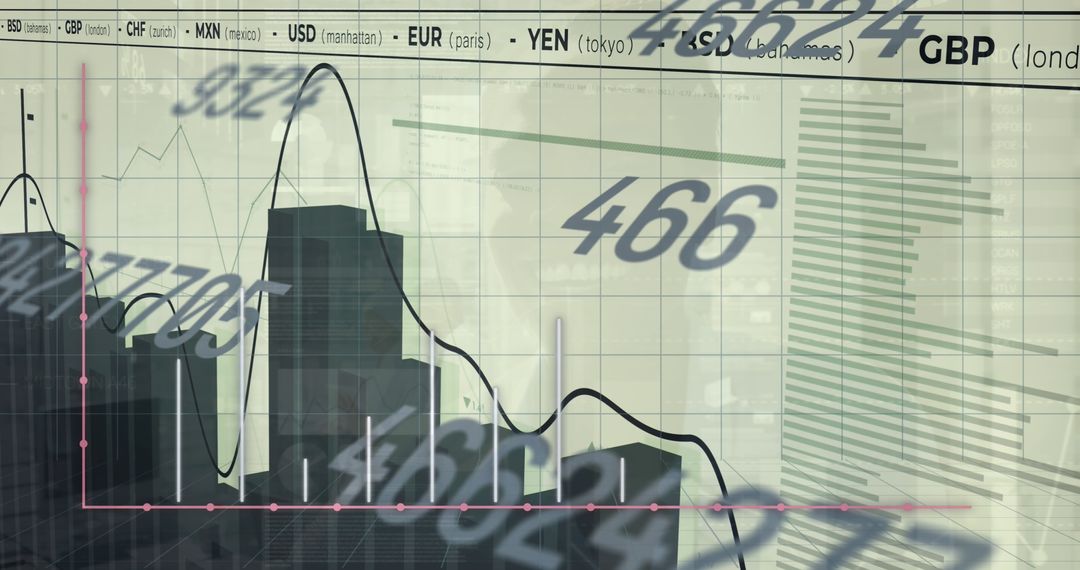
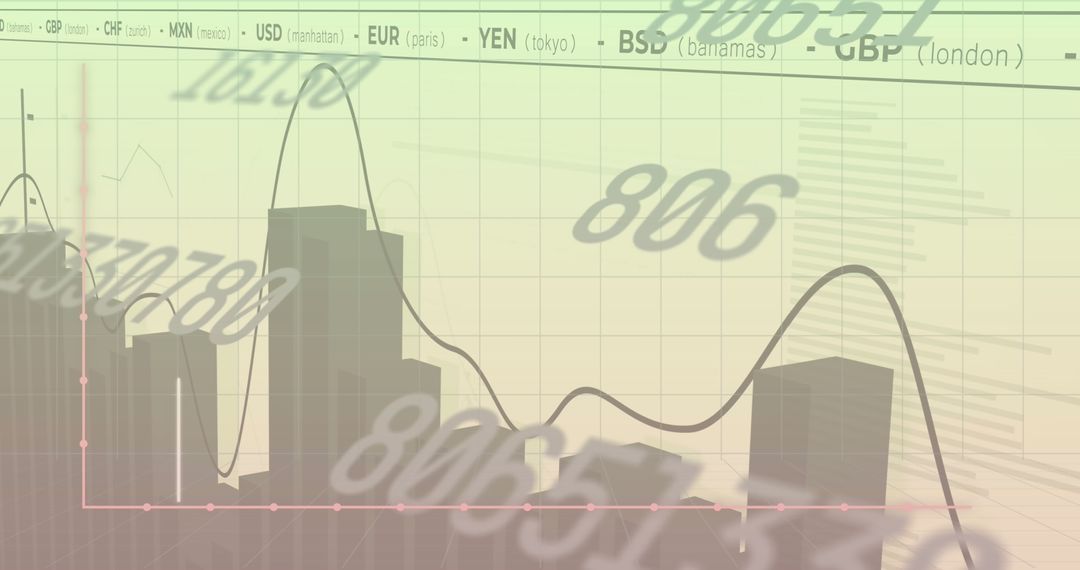
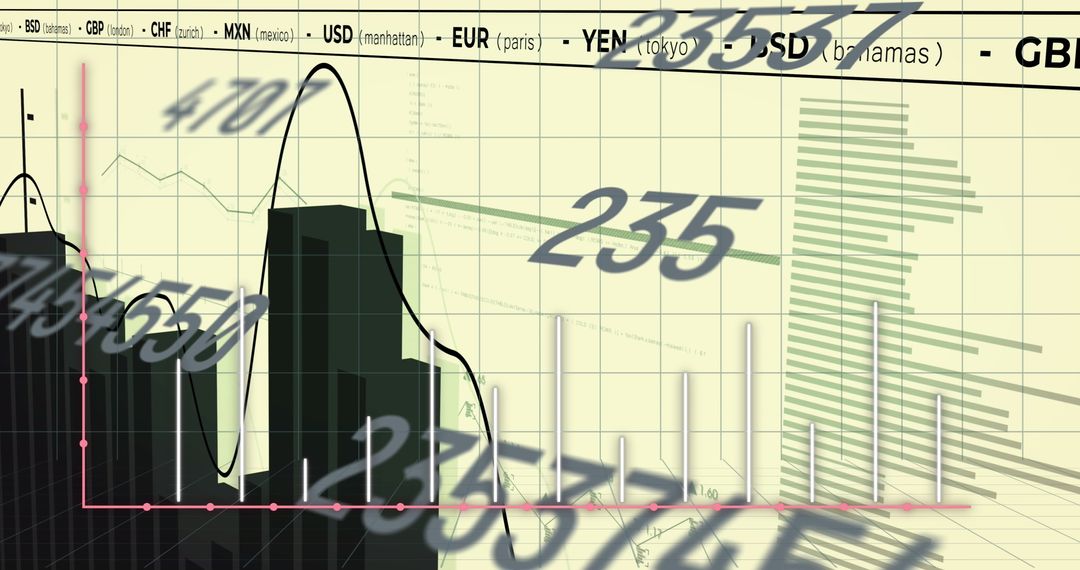
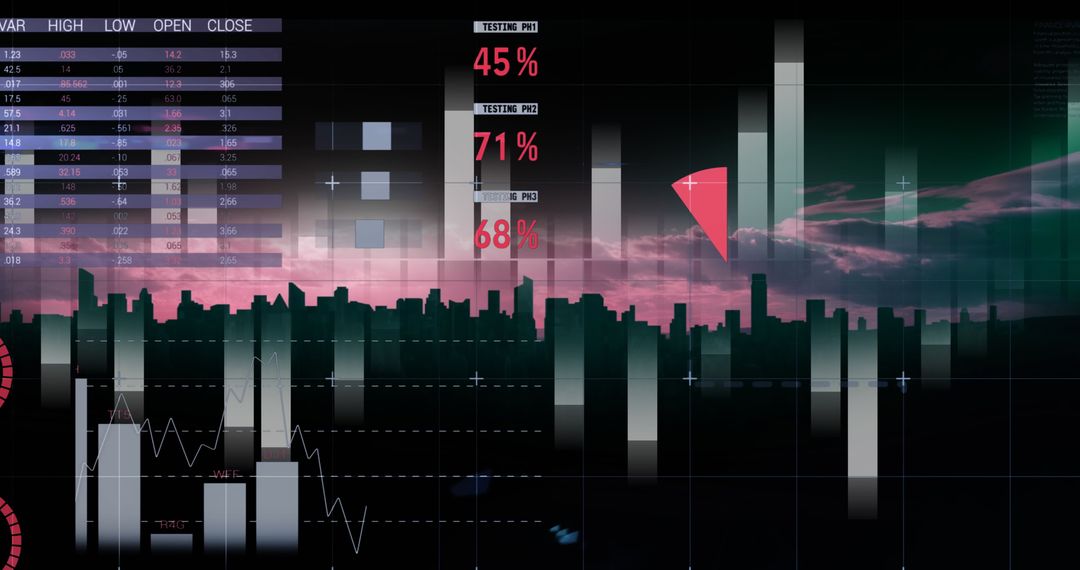
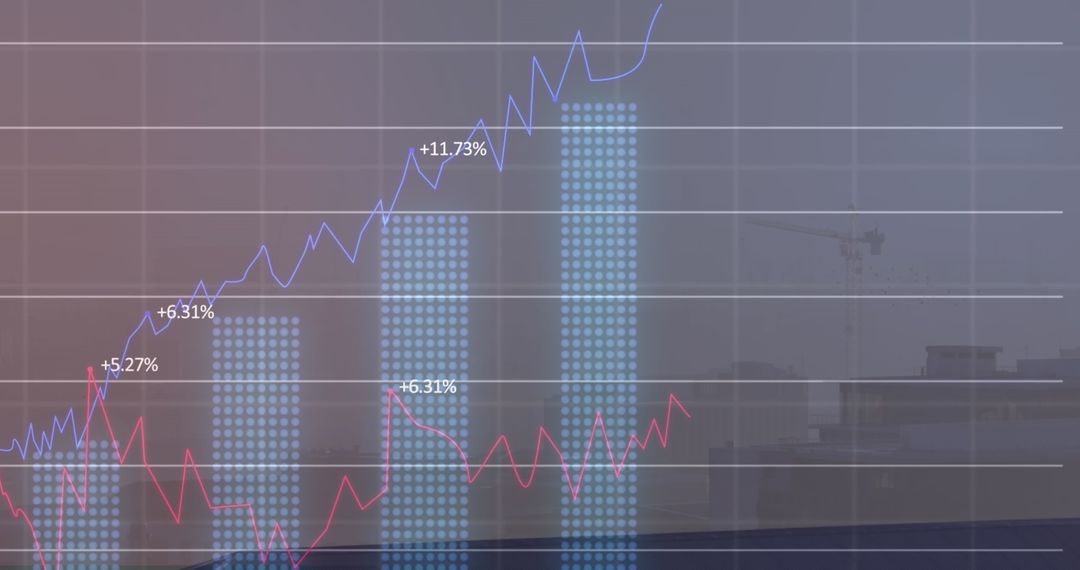
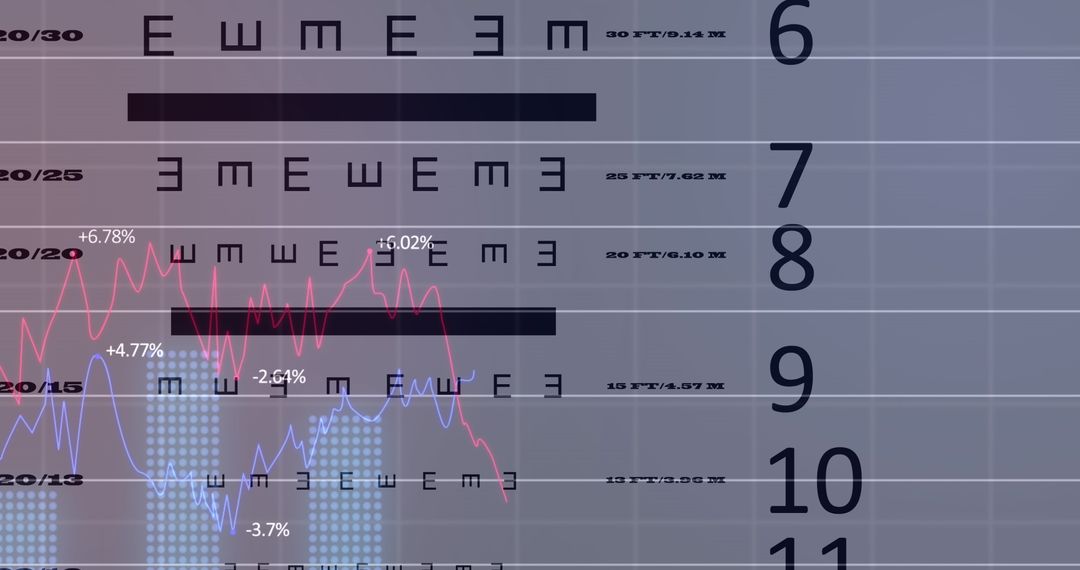
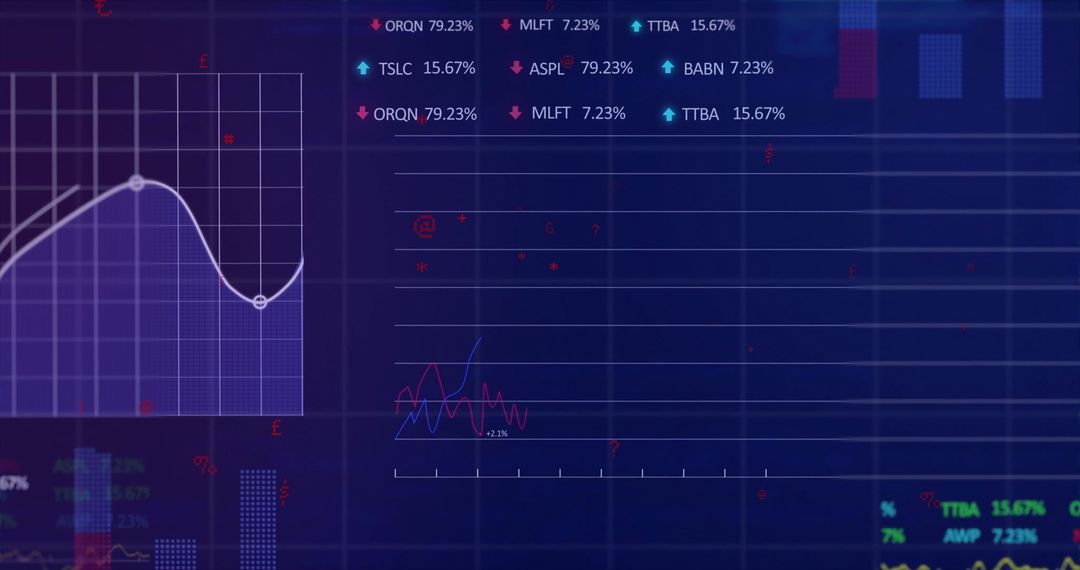
- Dynamic Financial Data Charts and Graphs Background
Dynamic Financial Data Charts and Graphs Background Image

Stocks overlay with fluctuating charts, showcasing business data processing aspects suggesting potential use in presentations related to economics, financial market reports, and technology discussions highlighting data comp.
Powered by 


2
downloads
downloads
Tags:
More
Credit Photo
If you would like to credit the Photo, here are some ways you can do so
Text Link
photo Link
<span class="text-link">
<span>
<a target="_blank" href=https://pikwizard.com/photo/dynamic-financial-data-charts-and-graphs-background/666f5f7068961bf40b6949c082b20e74/>PikWizard</a>
</span>
</span>
<span class="image-link">
<span
style="margin: 0 0 20px 0; display: inline-block; vertical-align: middle; width: 100%;"
>
<a
target="_blank"
href="https://pikwizard.com/photo/dynamic-financial-data-charts-and-graphs-background/666f5f7068961bf40b6949c082b20e74/"
style="text-decoration: none; font-size: 10px; margin: 0;"
>
<img src="https://pikwizard.com/pw/medium/666f5f7068961bf40b6949c082b20e74.jpg" style="margin: 0; width: 100%;" alt="" />
<p style="font-size: 12px; margin: 0;">PikWizard</p>
</a>
</span>
</span>
Free (free of charge)
Free for personal and commercial use.
Author: Creative Art
Similar Free Stock Images

Premium


Premium


Premium


Premium


Premium


Premium


Premium


Premium


Premium


Premium


Premium


Premium


Premium


Premium


Premium


Premium


Premium


Premium


Premium


Premium


Premium


Premium


Premium


Premium