1. Home > 
  2. Stock Photos > 
  3. Dynamic Financial Data Charts Over Grid Background

Dynamic Financial Data Charts Over Grid Background Image

Dynamic Financial Data Charts Over Grid Background

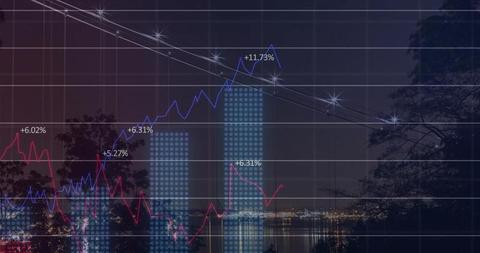
Visual representation combining financial charts with a grid network. Ideal for illustrating concepts related to business data processing, economic trends, and technology-driven finances. This can be utilized in presentations, educational materials, or tech blogs to emphasize data analysis in a modern environment.

Powered by Adobe logo
Abstract digital financial chart with dollar signs and data grid background - Powered by AdobeGlowing stock market chart on a grid, depicting financial data analysis and investment trends in a modern, futuristic style - Powered by AdobeFuturistic Financial Chart with Glowing Spheres on Grid and Distant Cityscape - Powered by AdobeFuturistic data center with glowing servers and 3D financial chart overlay. - Powered by AdobeStunning financial growth chart showing upward trends, perfect for presentations, reports and business analysis with a modern and professional aesthetic - Powered by Adobe

Credit Photo

If you would like to credit the Photo, here are some ways you can do so

Free (free of charge)

Free for personal and commercial use.

Author: People Creations

Similar Free Stock Images

Financial Data Analysis with Dynamic Growth Charts
Premium
Financial Data Volatility Chart
Dynamic Financial Data Graph Overlaying Urban Skyline
Premium
Abstract representation of fluctuating energy prices and market trends overlaid on a silhouette of high voltage power transmission towers against a twilight sky
Premium
Colorful digital abstract bars and lines forming a futuristic financial or data visualization with glowing vibrant hues in a high-tech environment
Digital Speedometer Gauge with Virtual HUD Interface Display
Displaying financial growth dashboard with bold upward arrow, line charts, dotted bar analytics
Dynamic Financial Data and Stock Market Interface
Holographic financial analytics dashboard displaying neon code with rising line charts
Premium
A glowing white line graph charting fluctuating data against a dark grid background, representing financial market trends and economic analysis
Digital Data Processing Overlay on Night Cityscape
Digital Financial Graph Illustrating Stock Market Trends
Abstract Digital Financial Data Graph Chart
Dynamic Global Economy and Trade Analysis
Premium
Fintech 3d data visualization of a glowing world map highlighting global financial connections in green on a dark grid background
Financial Data Analysis with Graphs and Charts on Abstract Grid
Dynamic Stock Market Graphics on Modern Digital Interface
Statistical Data on Orange Gradient Background
Financial Data Graphic with Rising Trends on Digital Grid
Premium
Magnifying glass focused on a digital global financial map displaying real-time stock market data, concept for global market research, financial technology investment and economic analysis
Premium
Global Data Visualization: A 3D Render of a World Map Displaying Information and Connectivity
Global Financial Data Analysis on Grid Background
City Skyline Merging with Financial Graphs Demonstrating Market Trends
Financial Data Visualization on Dark Background for Analysis
Financial Data Analytics Over Digital Grid Screen
Premium
Cybersecurity and Data Protection Growth Concept. Digital Padlock Icon Over an Upward Trending Financial Chart Representing Secure Business Success, Privacy, and Technology Advance
Digital Financial Data Graph with Winter Snowflake Theme
Modern Multi-Colored Financial Graphs on Digital Dashboard
Dynamic Financial Charts and Data in Futuristic Interface
Digital Financial Data Stream with Numeric Overlay
Dynamic Financial Statistics Overlay on Cityscape Background
Digital Graph and Data Analysis with Financial Growth Trends
Futuristic Data Analytics Dashboard with Security Icon
Digital Financial Graphs and Business Analytics on Blue Backdrop
Red Data Line Declining Across Digital Security Screen
Financial Data and Cityscape at Night with Rising Graph
Abstract Financial Growth Chart with Rising Bars and Line Graphs
Premium
A glowing arrow pointing upwards on a blue grid background representing growth and success trend
Financial Technology Interface with Candlesticks and Security Icon
Global Financial Markets and Technology Analysis
Financial Data Overlay on Modern Cityscape Illustrating Market Trends
Dynamic Stock Market Graph with Percentage Indicators
Data streams, digital interface for global business innovation
Premium
Neon Growth Chart with Arrow and Columns on Grid, Futuristic Business Concept
Dynamic Financial Graphs Illustrating Market Trends and Data
Network of Connections and Financial Data on Graph
3D Financial Data Imagery with Graphs and Charts on White
Financial Graph Illustrating Stock Market Growth Over Cityscape
Premium
Abstract blue financial graph illustrating data analysis and trading insights
Server Racks in Data Center with Digital Line Chart Overlay
Statistical Data and Trends Over Digital Grid Overlay
Analysis of Financial Data with Graph Trends and Bokeh Lights
Digital Connectivity Network on Global Graph Background
Dynamic Financial Graphs on Digital Screen Displaying Market Trends
Premium
Digital financial market data visualization with stock chart trending upwards and global network grid overlay for financial technology and investment analysis concepts
Digital Financial Data Analysis and Stock Market Charting
Global Financial Data and Graphs Over Digital Globe Interface
Stock Market Data Visuals Displaying Financial Analysis Trends
Global Currency Symbols and Financial Network Graph
Premium
Orange 3d arrow pointing upwards on a grid background with blue lines and dots symbolizing growth and progress in a futuristic technology concept with dramatic lighting
Financial Data Processing Over Digital Grid with Code Elements
Innovative Technology Concept with Blurred Metrics and Lights
Interactive Data Analysis with Virtual Avatars and Visual Elements
Businesswoman Engaging with Futuristic Financial Data Interface
Premium
Abstract digital data visualization with glowing blue and orange financial graph lines on a dark background representing market trends and data analysis
Financial Charts with Blue and Red Lines and Digital Percent Indicators
Financial Data Over Grid Indicating Market Trends and Analytics
Financial Charts Over Cityscape Reflecting Economic Trends
Dynamic Financial Data with Global Connections and Insights
Premium
Financial market data showing stock performance, growth trends, and investment analysis with digital technology integration for investors
Premium
Abstract glowing blue arrows rising up from a digital network grid
Financial Data Visualization on Digital Grid
Global Financial Data Overlaid on Cityscape Background
Financial Data Analysis Graph with Growing Trends
Digital Financial Analytics Dashboard with Trend Indicators
Premium
Stock Market Graph Glowing in Blue Neon with Futuristic Grid and Bokeh Cityscape
Data Analytics with Dynamic Global Market Trends on Screen
Financial Data Analysis with Stock Market Graphs
Global Financial Data and Stock Market Visualization
Digital Finance Dashboard with Rising Graph and Percentages
Premium
Business professionals engage in a lively discussion about digital home connectivity, analyzing data and strategizing future projects in a modern office environment. Gantry
Data Analytics and Stock Market Graphs
Dynamic Digital Stock Market Graph with Fluctuating Trends
Soundwaves with Graph Overlays in Data Processing Concept
Digital Data Analytics Growth Trend with Graphs
Digital Data Visualization with Futuristic Infographics
Financial Data and Growth Arrows Boosting Business Success
Premium
Digital golden bar graph showing stock market finance data
Financial Data Graphs Over Cityscape Indicating Global Business Concept
Abstract Financial Data Display with Analytical Graphs
Abstract Graph Display with Dynamic Business Growth Indicators
Financial Data Charts with Viewing Grid in Dark Perspective
Premium
Renewable energy landscape with wind turbines and solar panels overlaid with a financial stock market graph symbolizing growth and investment in green technology
Digital Stock Market Data Visualization with Rising and Falling Prices
Visualizing Financial Trends on Digital Grid Background
Analyzing Digital Market Trends on a Financial Graph
Dynamic Global Financial Analytics with Rising Graph Visualization
Global Financial Market Positive Trend Visualization
Data Visualization on Tablet Screen with Graph Interface
Global Data Processing Over Cityscape Night View
Digital Data Processing Over Cityscape at Night
Ukraine Crisis Financial Graphs Overlay
Digital Finance Interface with Dynamic Trading Data Displays
Financial Stock Market Trends Over Digital Grid Background
Premium
Colorful progress graph trending upwards through atmospheric clouds symbolizing financial growth and future success
Digital Data Process and Analysis on Blue Background
Dynamic Stock Market Ticker Display with Financial Graphs
Digital Financial Data and Dynamic Stock Market Graphs
Financial Data Analysis with Graphical Digital Interface
Premium
Lush green rows blend into financial data, suggesting growth and economic interplay, overlaid with lines and charts
Financial Market Trends with Ukraine Flag Symbolism in Background
Trending Financial Graphs with Red and Blue Analytics Lines
Dynamic Financial Graph with Data Analysis Conceptual Background
Abstract Financial Chart with Rising and Falling Indicators
Social Media Analytics Dashboard Showing Real-Time Likes Comments Followers on 3D Grid
Premium
Digital data visualization shows intelligence and innovation shaping future of technology and digital literacy in dynamic colorful graph
Abstract Digital Data Charts and Graphs on Screen
Digital Soundwaves with Data Graphs and Coding Elements
Dynamic Financial Data Growth Chart Display
Cryptocurrency Market Data with Digital Charts and Graphs
Premium
Digital glowing zigzag line chart over blue abstract data grid background illustrating financial or technological growth and analysis
Stock Market Trends and Data Analysis over Digital Grid
Global Finance and Technology Concept with Dynamic Charts
Statistics and Data Processing with Graphs and Charts
Premium
Global Business Growth Chart with Earth, Financial Data and Technology
Explore More Free Stock Images