1. Home > 
  2. Stock Photos > 
  3. Dynamic Financial Data Charts with Coding Interface

Dynamic Financial Data Charts with Coding Interface Image

Dynamic Financial Data Charts with Coding Interface

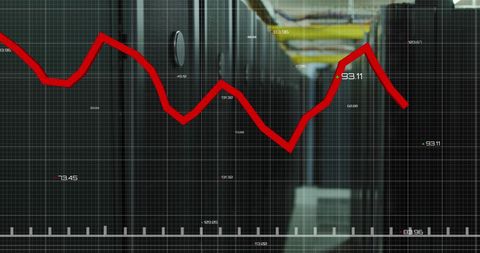
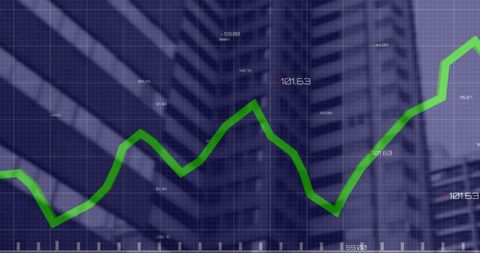
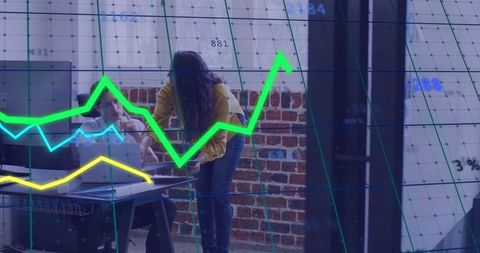
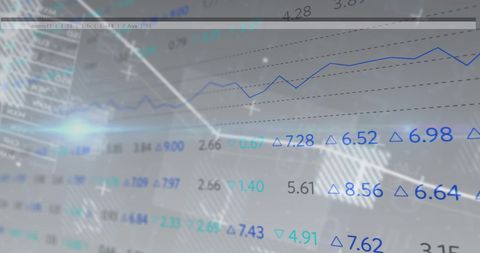
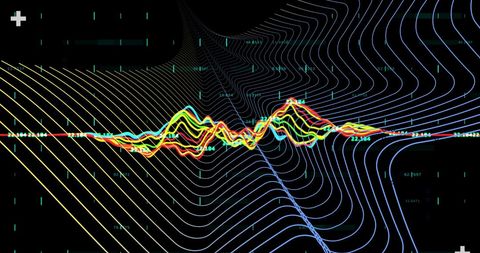
Illustration showing various financial graphs and coding elements on dark background. Useful for conveying themes of financial technology, data-driven investment analysis, stock market dynamics, or financial strategy presentations. Can be used in articles, business tools, or technology showcases.

Powered by Adobe logo
Digital screens present a futuristic interface with various graphs, charts, and information, visualizing complex data and technology concepts for business intelligence and communication - Powered by AdobeAbstract digital circuit design with glowing elements and data visualization resembling financial graphs. - Powered by AdobeA person analyzes data on multiple screens, surrounded by digital graphs and charts, indicating a high-tech, analytical environment. - Powered by AdobeFuturistic data visualization with glowing neon graphs and charts - Powered by AdobeData analysis Holographic projection showing graphs and charts on tablet with cityscape in background modern technology concept - Powered by Adobe

Credit Photo

If you would like to credit the Photo, here are some ways you can do so

Free (free of charge)

Free for personal and commercial use.

Author: People Creations

Similar Free Stock Images

Premium
A robotic hand engages with a digital dashboard showcasing interactive graphs and a world map, representing the fusion of technology and analytics in modern data monitoring. Impute
Futuristic Financial Graphs with Dynamic Green Line
Neon Stadium and Data Integration in Digital Interface
Animated Financial Chart Depicting Stock Market Trends
Data Processing Overlay on Office Workspace
Digital Data Analysis Concept with Graph Interface
Financial Data Overlay on Office Computers
Financial Data Visualization on Digital Grid
Financial Data Analysis with Vibrant Lines on Blue Background
Dynamic Financial Data Charts on Dark Digital Background
Abstract Financial Graph Displayed on Office Monitor
Premium
A businessman holds a floating AI processor with a holographic interface, connecting to the cloud. This image symbolizes the power of artificial intelligence in business, data analysis, and automation
Premium
Close up of hands typing on a laptop displaying complex data analytics and charts
Dynamic Stock Market Data and Cityscape Background
Digital Data Visualization and Interface Technology Concept
Global Financial Graph Showing Decline Indicating Recession
Futuristic Data Analysis with Digital Graphs on Gradient
Dynamic Multicolored Graphs on Abstract Digital Finance Background
Digital Financial Data Representation with Abstract Graph
Global Network Analysis with Dynamic Digital Data
Digital Display of Financial Decline Graph and Data Connectivity
Futuristic Financial Data Analysis with Rising Stock Chart
Abstract Financial Data Processing Analysis Background
Dynamic Green Graph on Futuristic Technological Interface
Financial Data Analysis Over Vibrant Cityscape Background
Premium
Close-up of a hand typing on a laptop with digital financial data and charts on screen, glowing particles
Dynamic Digital Financial Interfaces over Urban Cityscape
Stock Market Trends and Data Analysis over Digital Grid
Analyzing Financial Graphs with Colorful Chart Lines
Colorful Line Graphs Displaying Data Over City Skyline
Premium
Person using a laptop with a futuristic holographic interface displaying data and workflow diagrams.
Futuristic 3D Financial Dashboard Displaying Neon Cyan Orange Line Charts with Grid View
Analyzing Graph Showing Market Economy Stock Crisis
Financial Trends with Power Line Graphic Overlay
Dynamic Waves and Graphs on Black Background
Financial Data Processing on Dynamic Digital Interface
Green Financial Data Line Graph Over Cityscape Background
Premium
A hand interacts with a digital display showcasing data visualizations, charts and graphs, illuminated with bright hues, against a dark, blurred backdrop
Financial Data Graph Overlay on Modern Office Background
Green Line Graph Overlaid on Empty Office with Data Overlay
Dynamic Stock Market Graph with Percentage Indicators
Futuristic Business Data Graphs over City Skyline
Premium
Futuristic neon glowing 2026 numbers
Global Financial Data Processing with Graphs and Charts on Dark Background
Dynamic Financial Statistics with Cityscape Overlay
Declining Graph Showing Market Trends
Digital Network with Declining Graph Overlay
Premium
Businessman analyzing data science and AI analytics on futuristic virtual touchscreen interface
Financial Data Visualization with Rising Trends
Global Financial Data Analysis on Grid Background
Financial Market Chart on Digital Screen Showing Growing Trends
Growing Financial Trends on Urban Skyline Background
Premium
Businessman interacting with futuristic digital network technology
Premium
Elegant businesswoman analyzing data on futuristic holographic interface screen
Dynamic Financial Data Growth Chart Display
Dynamic Stock Market and Financial Data Analysis Concept
Financial Graph with Line Trending Upwards on Navy Background
Red Decline Line with Data Overlapping Server Room Background
Premium
Laptop with data analysis interface digital illustration
Abstract Financial Data Over Cityscape Imagery
Cityscape Blended with Graphs Showing Finance Trends
Futuristic Financial Charts with Virtual Arrows
Abstract Financial Graphs and Data Over Cityscape
Dynamic Financial Data Visualization on Grey Background
Futuristic Data Analysis Interface with Dynamic Graphs
Premium
Vast amounts of complex data displayed on a glowing computer screen for analysis
Premium
Isometric data analytics platform with a growing bar chart. Digital technology and business intelligence concept for financial growth.
Premium
Futuristic financial data graph glowing on digital screen interface with abstract city lights background, ideal for finance technology, stock analytics, cryptocurrency, and smart data concept visuals
Dynamic Financial Graph Line with Alphanumeric Digital Background
Dynamic Financial Growth Graph on Blue Grid Background
Red Economy Chart Displays Market Downturn Digital Background
Premium
Hands typing on a laptop with futuristic glowing blue digital data charts and graphs overlay
Premium
Businessman interacting with futuristic data visualization interface
Dynamic 3D Forex Line Graph on Digital Grid Display
Financial Data Overlaid on Warehouse Representing Trade and Logistics
Financial Graph with Data Analysis and Market Statistics
Digital Business Interface with Network Connections Over Office Desk
Premium
Hand adding dot to performance heatmap chart
Statistical Data and Trends Over Digital Grid Overlay
Downward Stock Market Trends with Financial Data Graphs
Digital Data Analytics Growth Trend with Graphs
Green Line Graph Depicting Sustainability and Environmental Icons
Premium
Businessman interacting with futuristic annuity interface
Business Data Analysis with Red Declining Graph on Office Desk Background
Red Financial Trendline in Digital Interface Background
Dynamic Red Line Graph on Digital Black Grid Background
Abstract Financial Data Lines Overlay in Modern Office
Premium
A person in a suit typing on a laptop keyboard with digital data visualizations overlayed, symbolizing technology, data analysis, and business intelligence
Financial Data Visualization on Graph with Glowing Indicator
Abstract Financial Graph on Dark Digital Background
Dynamic Financial Graph with Statistical Analysis Lines
Abstract Digital Finance Graph Interface Display
Red Line Graph Showing Downward Trend on Black Grid Background
Financial Data Graphics Overlaying Abstract Flames Background
Financial Data Market Chart Analysis with Digital Overlay
Dynamic Financial Data Analytics Display on Dark Background
Financial Data Charts Displayed Over Skyscraper Reflection
Stock Market Decline Data Analysis on Dark Grid Background
Financial Market Decline with Red Line Graph Overlay
Rising Financial Graph Over Urban Skyscrapers
Red Line Graph Overlaying Office Computers Symbolizing Data Analysis
Premium
A focused team analyzes data trends on multiple computer screens, showcasing financial graphs and metrics for informed decision-making.
Digital Finance Data Integrated with Urban Cityscape
Digital Interface Monitoring Cityscape in Futuristic Design
Financial Data Analysis with Digital Grid Chart
Digital Data Interface with Analyzing System Graphs
Dynamic Financial Graphs Illustrating Market Trends and Data
Red Financial Graph Indicates Declining Market Trends
Declining Financial Chart Displayed Over Urban Cityscape
Abstract Financial Data Chart Analysis on Grid Background
Financial Data Growth Over Urban Cityscape with Graph Overlay
Premium
Businessman interacts with futuristic global data interface on blue background 20251212
Premium
Advanced data analytics and business performance dashboard with a futuristic glowing chart interface
Red Graph Falling over Black and White Office Background
Dynamic Business Analytics and Data Processing Visualization
Digital Data Analytics Overlay in Modern Office Environment
Financial Growth Graph Amid Urban Skyline Background
Premium
A digital scene depicts a robotic hand engaged with intricate data visualizations and graphs, representing advancements in technology and artificial intelligence applications. Scalp
Urban Cityscape with Financial Graphs and Data Integration
Financial Data Graphs Over Cityscape Indicating Global Business Concept
Digital Data Interface on Car Panel with Financial Trends
Abstract Business Technology Data Presentation
Premium
Futuristic financial data graph glowing on digital screen interface with abstract city lights background, ideal for finance technology, stock analytics, cryptocurrency, and smart data concept visuals
Premium
AI risk controls concept with person interacting with digital data and glowing red graph line in futuristic technology environment
Financial Graphs with Cityscape Background Reflecting Market Trends
Explore More Free Stock Images