- Home >
- Stock Photos >
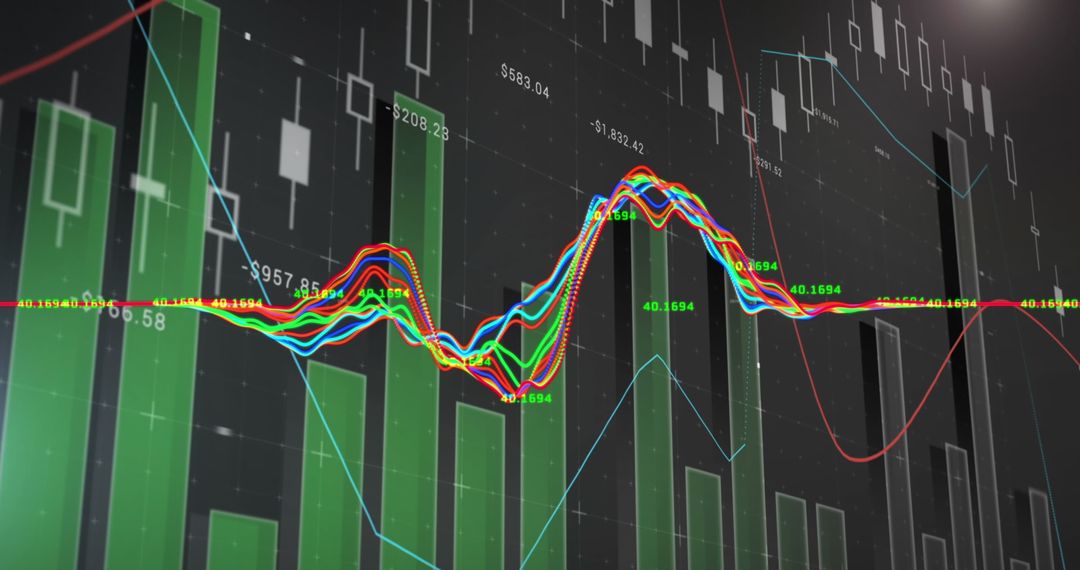
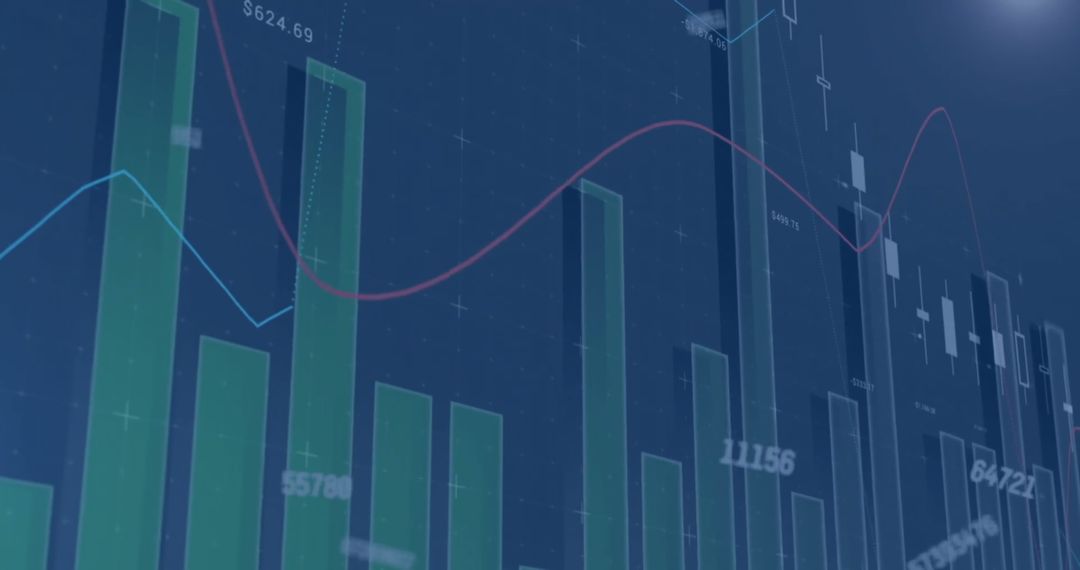
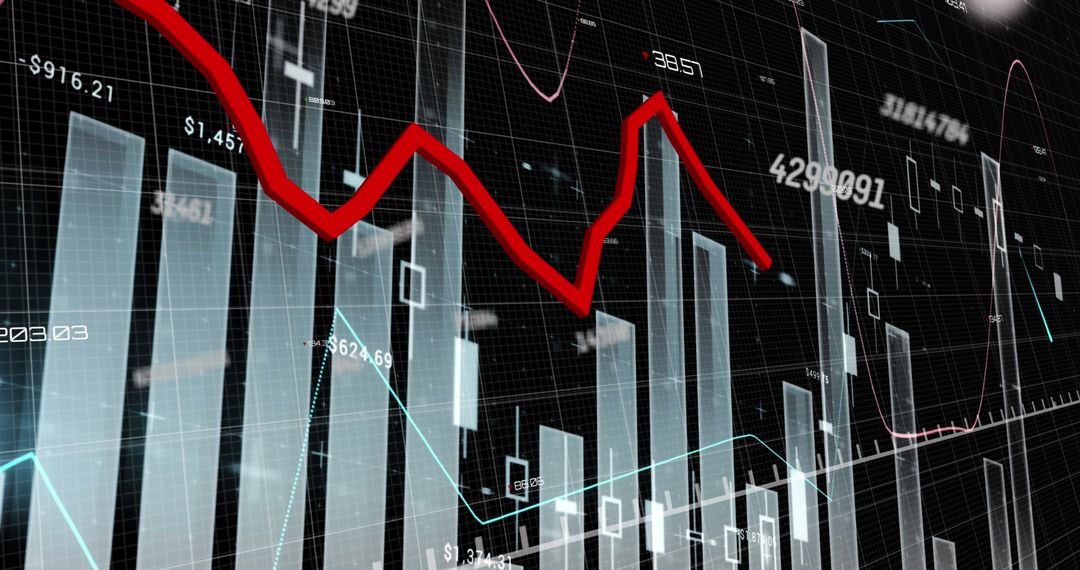
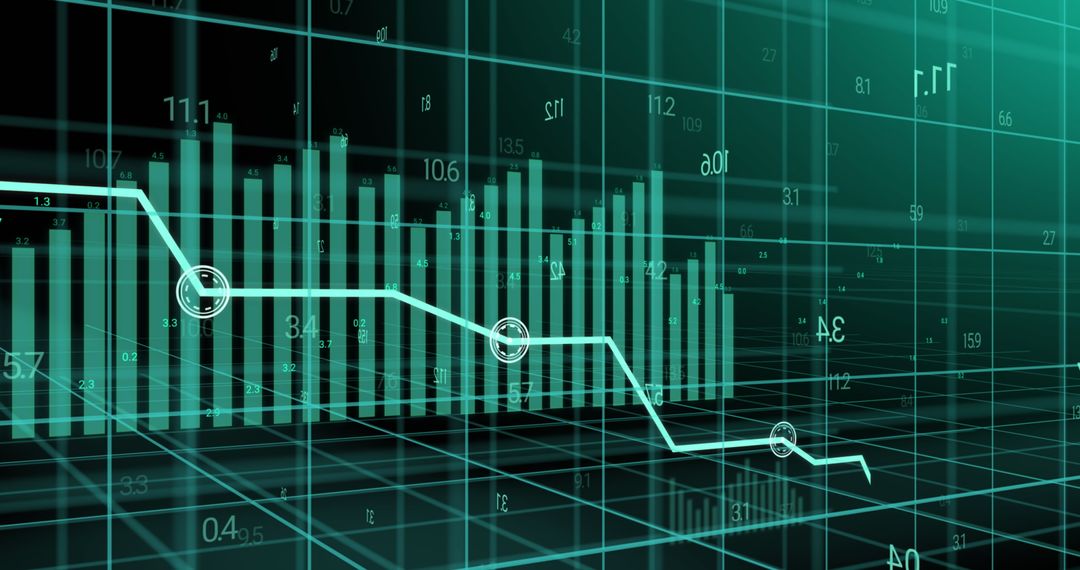
- Dynamic Financial Data Charts with Global Business Analytics
Dynamic Financial Data Charts with Global Business Analytics Image

Presents dynamic financial charts representing stock market analytics, communicating global business insights. Useful for illustrating financial reports, presentations on market trends, or business strategy discussions. Emphasizes finance-oriented environments or educational materials related to economics and data analysis.
Powered by  - Get 15% off with code: PIKWIZARD15


8
downloads
downloads
Tags:
More
Credit Photo
If you would like to credit the Photo, here are some ways you can do so
Text Link
photo Link
<span class="text-link">
<span>
<a target="_blank" href=https://pikwizard.com/photo/dynamic-financial-data-charts-with-global-business-analytics/9293af147947c0e404e35973a07c596b/>PikWizard</a>
</span>
</span>
<span class="image-link">
<span
style="margin: 0 0 20px 0; display: inline-block; vertical-align: middle; width: 100%;"
>
<a
target="_blank"
href="https://pikwizard.com/photo/dynamic-financial-data-charts-with-global-business-analytics/9293af147947c0e404e35973a07c596b/"
style="text-decoration: none; font-size: 10px; margin: 0;"
>
<img src="https://pikwizard.com/pw/medium/9293af147947c0e404e35973a07c596b.jpg" style="margin: 0; width: 100%;" alt="" />
<p style="font-size: 12px; margin: 0;">PikWizard</p>
</a>
</span>
</span>
Free (free of charge)
Free for personal and commercial use.
Author: People Creations
Similar Free Stock Images

Premium


Premium


Premium


Premium


Premium


Premium


Premium


Premium


Premium


Premium


Premium


Premium


Premium


Premium


Premium


Premium


Premium


Premium


Premium


Premium


Premium


Premium


Premium


Premium