
- Home >
- Stock Photos >
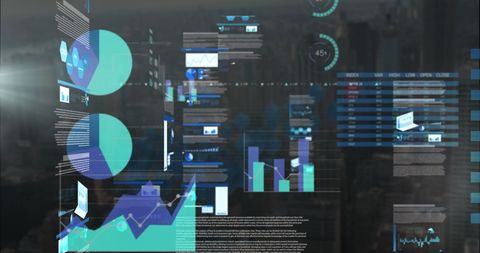
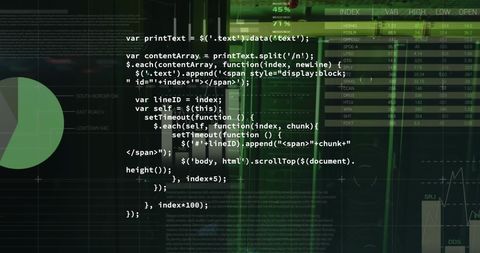
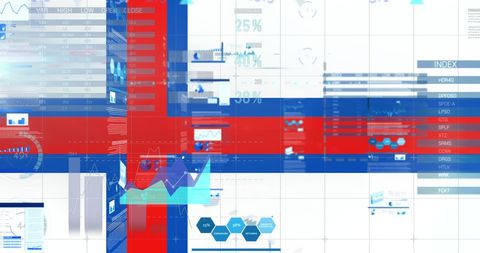
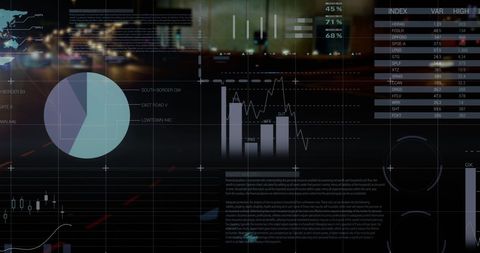
- Dynamic Financial Data Dashboard with Global Network Visualization
Dynamic Financial Data Dashboard with Global Network Visualization Image
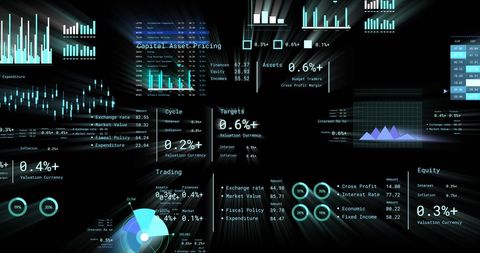
A vibrant display of financial data processing concepts shows dynamic numbers and graphs over a black background, portraying elements like capital asset pricing, trade information, and market value percentages. This representation is perfect for illustrating themes of global business, data analysis, digital finance technology, or use in presentations concerning financial market updates and corporate fiscal reports.
Powered by  - Get 15% off with code: PIKWIZARD15


downloads
Tags:
More
Credit Photo
If you would like to credit the Photo, here are some ways you can do so
Text Link
photo Link
<span class="text-link">
<span>
<a target="_blank" href=https://pikwizard.com/photo/dynamic-financial-data-dashboard-with-global-network-visualization/53b9f33d9a0c139d9dfe14fb5967594b/>PikWizard</a>
</span>
</span>
<span class="image-link">
<span
style="margin: 0 0 20px 0; display: inline-block; vertical-align: middle; width: 100%;"
>
<a
target="_blank"
href="https://pikwizard.com/photo/dynamic-financial-data-dashboard-with-global-network-visualization/53b9f33d9a0c139d9dfe14fb5967594b/"
style="text-decoration: none; font-size: 10px; margin: 0;"
>
<img src="https://pikwizard.com/pw/medium/53b9f33d9a0c139d9dfe14fb5967594b.jpg" style="margin: 0; width: 100%;" alt="" />
<p style="font-size: 12px; margin: 0;">PikWizard</p>
</a>
</span>
</span>
Free (free of charge)
Free for personal and commercial use.
Author: Awesome Content
Similar Free Stock Images

Premium


Premium

Premium

Premium


Premium


Premium


Premium


Premium


Premium


Premium


Premium


Premium

Premium


Premium

Premium


Premium


Premium


Premium


Premium

Premium

Premium


Premium


Premium

Premium


Premium


Explore More Free Stock Images