
- Home >
- Stock Photos >
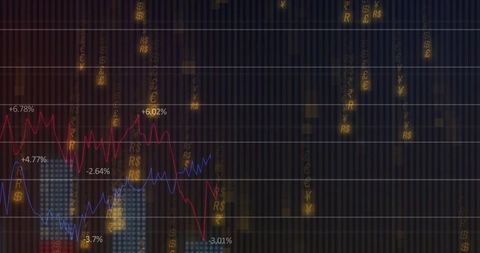
- Dynamic Financial Data Dashboard with Graphs and Currency Indicators
Dynamic Financial Data Dashboard with Graphs and Currency Indicators Image
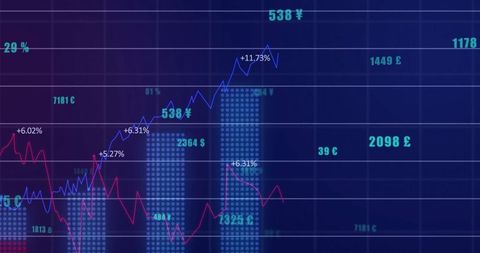
Illustrating mix of currency symbols, percentage labels, and graphical data, conveying a sense of financial movement and analytics. Appealing to financial institutions, educational platforms, and businesses looking to include financial data imagery in reports, presentations, or courses.
Powered by 


downloads
Tags:
More
Credit Photo
If you would like to credit the Photo, here are some ways you can do so
Text Link
photo Link
<span class="text-link">
<span>
<a target="_blank" href=https://pikwizard.com/photo/dynamic-financial-data-dashboard-with-graphs-and-currency-indicators/6f2f0a7311da4808d74db4c2c90f736b/>PikWizard</a>
</span>
</span>
<span class="image-link">
<span
style="margin: 0 0 20px 0; display: inline-block; vertical-align: middle; width: 100%;"
>
<a
target="_blank"
href="https://pikwizard.com/photo/dynamic-financial-data-dashboard-with-graphs-and-currency-indicators/6f2f0a7311da4808d74db4c2c90f736b/"
style="text-decoration: none; font-size: 10px; margin: 0;"
>
<img src="https://pikwizard.com/pw/medium/6f2f0a7311da4808d74db4c2c90f736b.jpg" style="margin: 0; width: 100%;" alt="" />
<p style="font-size: 12px; margin: 0;">PikWizard</p>
</a>
</span>
</span>
Free (free of charge)
Free for personal and commercial use.
Author: Awesome Content
Similar Free Stock Images

Premium


Premium


Premium


Premium


Premium


Premium

Premium


Premium


Premium


Premium

Premium


Premium


Premium


Premium

Premium


Premium


Premium


Premium


Premium


Premium


Premium


Premium

Premium
Premium

Premium


Explore More Free Stock Images