
- Home >
- Stock Photos >
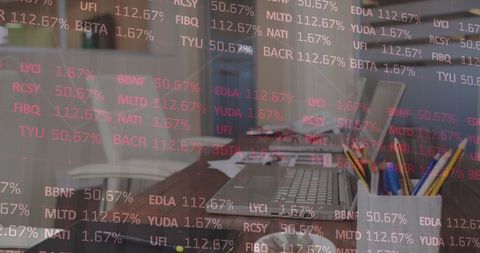
- Dynamic Financial Data Digital Interface Graphs and Charts
Dynamic Financial Data Digital Interface Graphs and Charts Image

This visual showcases a digital interface filled with intricate financial charts and graphs overlaid in a business environment. Useful for presentations on finance, stock market analytics, data visualization techniques, and investment technologies. Ideal for conveying concepts of economic forecasting, digital transformation in finance, or showcasing a modern, tech-savvy atmosphere for finance-related projects.
Powered by  - Get 15% off with code: PIKWIZARD15


downloads
Tags:
More
Credit Photo
If you would like to credit the Photo, here are some ways you can do so
Text Link
photo Link
<span class="text-link">
<span>
<a target="_blank" href=https://pikwizard.com/photo/dynamic-financial-data-digital-interface-graphs-and-charts/7322cfd2bb13d36c1f042298ba152bf4/>PikWizard</a>
</span>
</span>
<span class="image-link">
<span
style="margin: 0 0 20px 0; display: inline-block; vertical-align: middle; width: 100%;"
>
<a
target="_blank"
href="https://pikwizard.com/photo/dynamic-financial-data-digital-interface-graphs-and-charts/7322cfd2bb13d36c1f042298ba152bf4/"
style="text-decoration: none; font-size: 10px; margin: 0;"
>
<img src="https://pikwizard.com/pw/medium/7322cfd2bb13d36c1f042298ba152bf4.jpg" style="margin: 0; width: 100%;" alt="" />
<p style="font-size: 12px; margin: 0;">PikWizard</p>
</a>
</span>
</span>
Free (free of charge)
Free for personal and commercial use.
Author: Authentic Images
Similar Free Stock Images

Premium


Premium


Premium


Premium


Premium


Premium


Premium

Premium


Premium


Premium


Premium


Premium


Premium


Premium


Premium


Premium


Premium

Premium


Premium


Premium

Premium


Premium


Premium


Premium


Premium

Explore More Free Stock Images