- Home >
- Stock Photos >
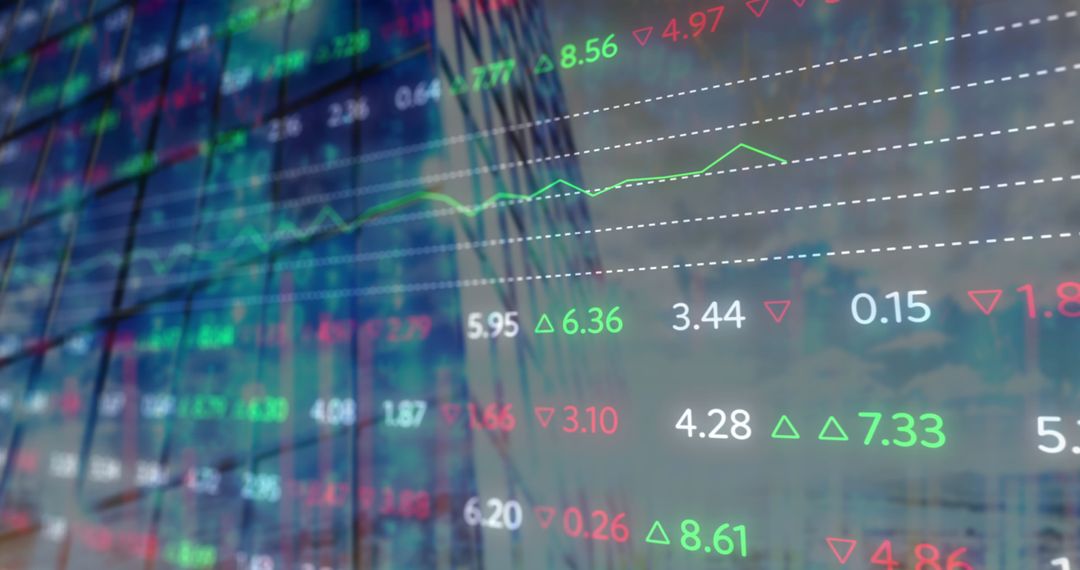
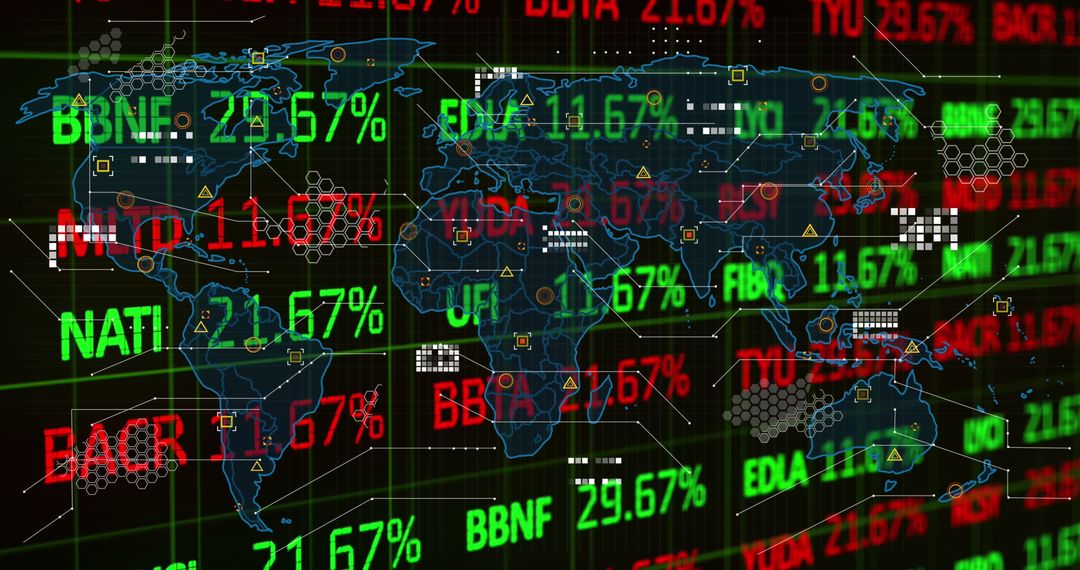
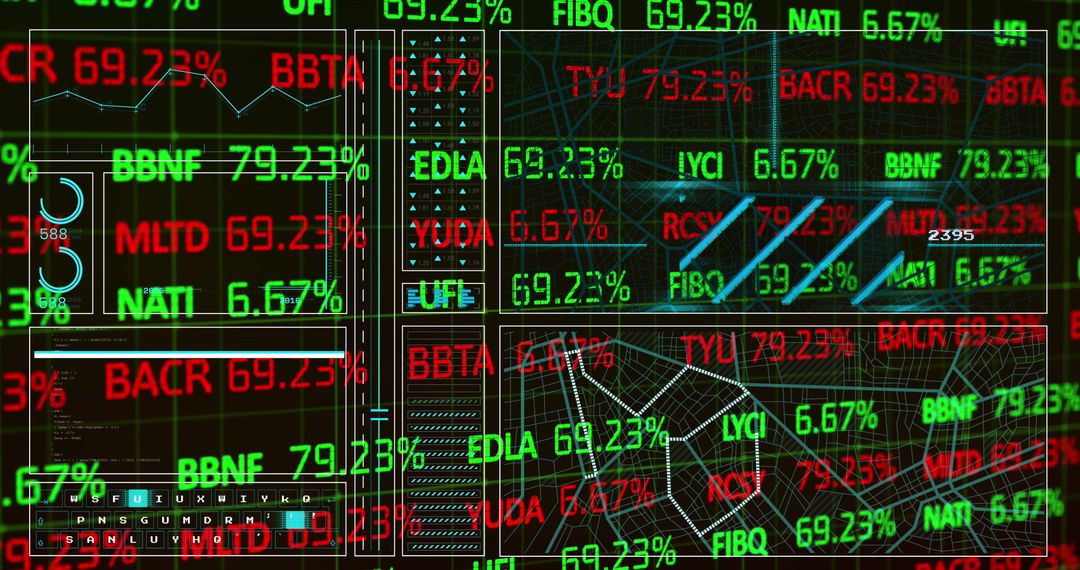
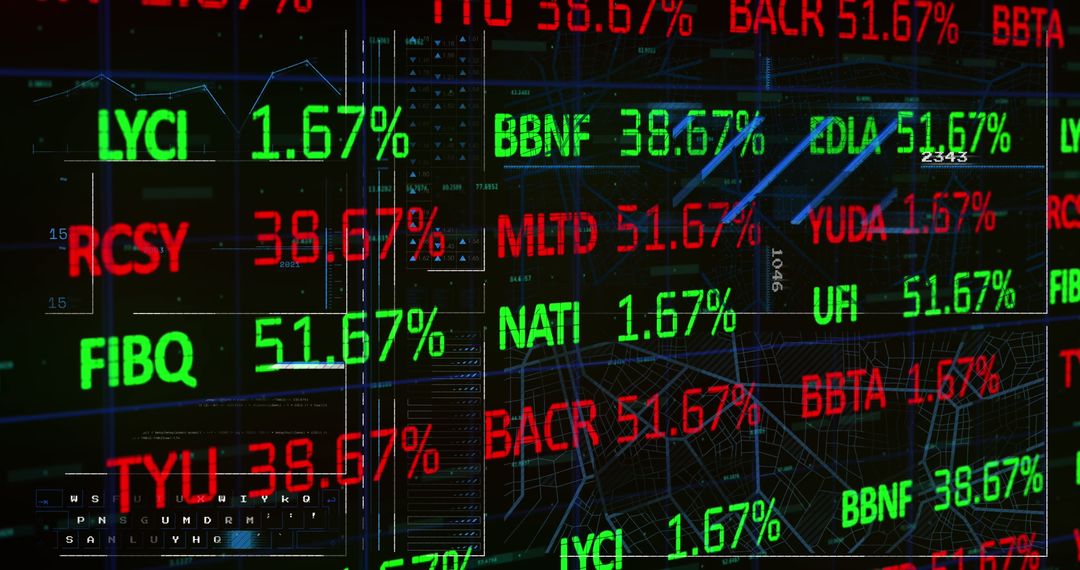
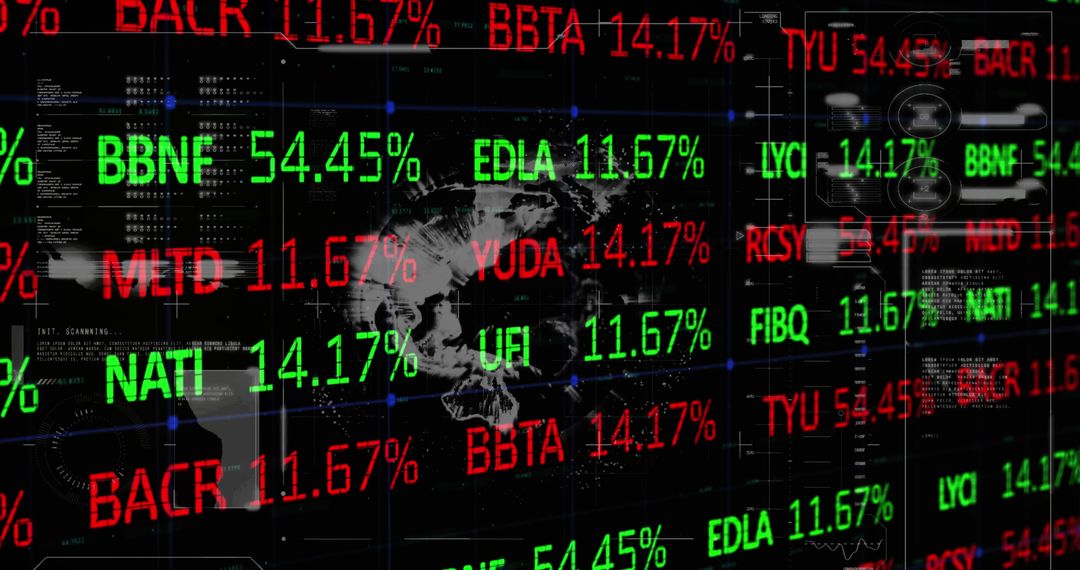
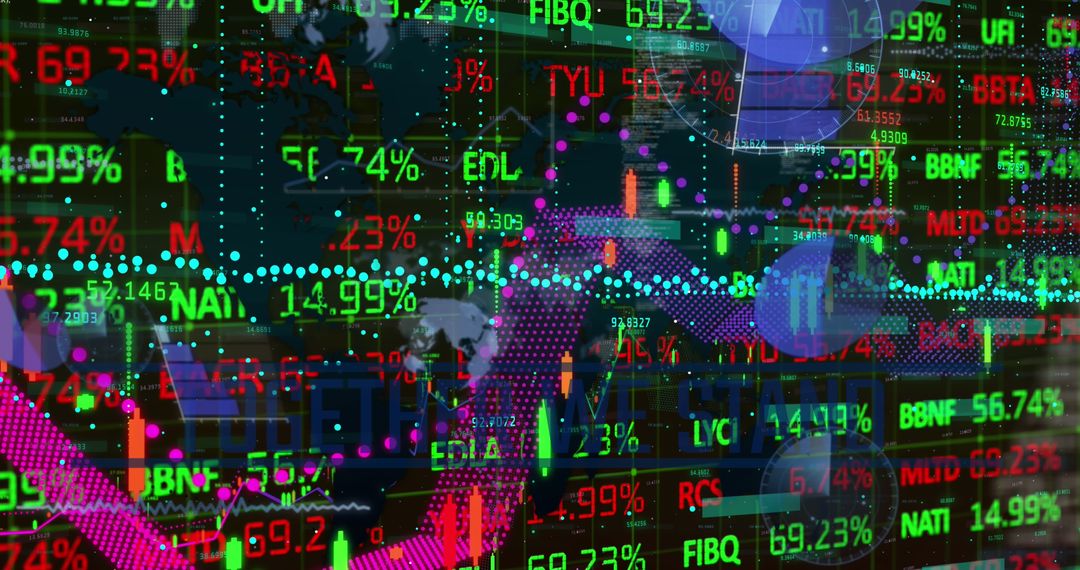
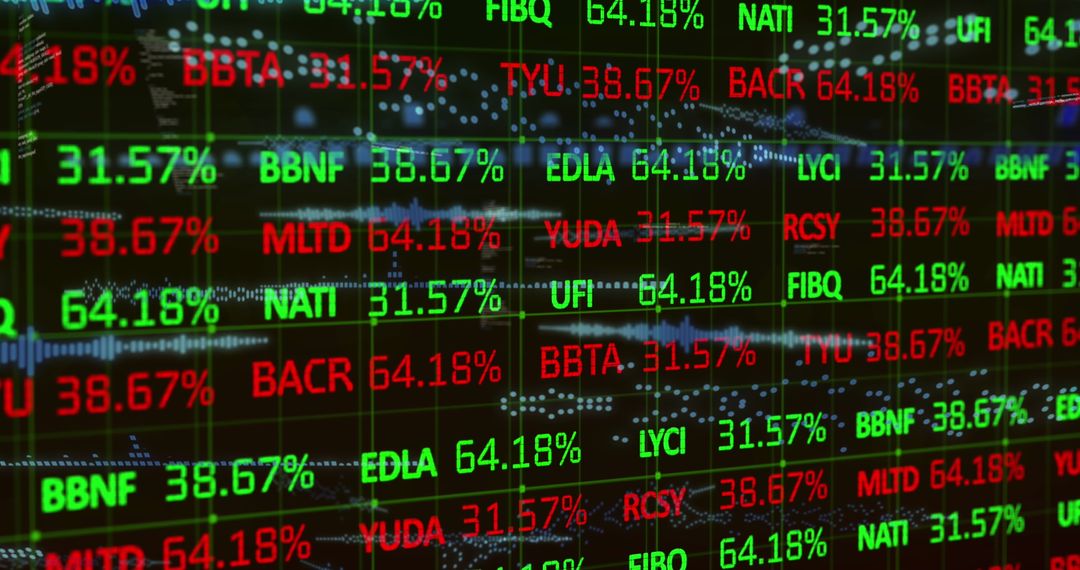
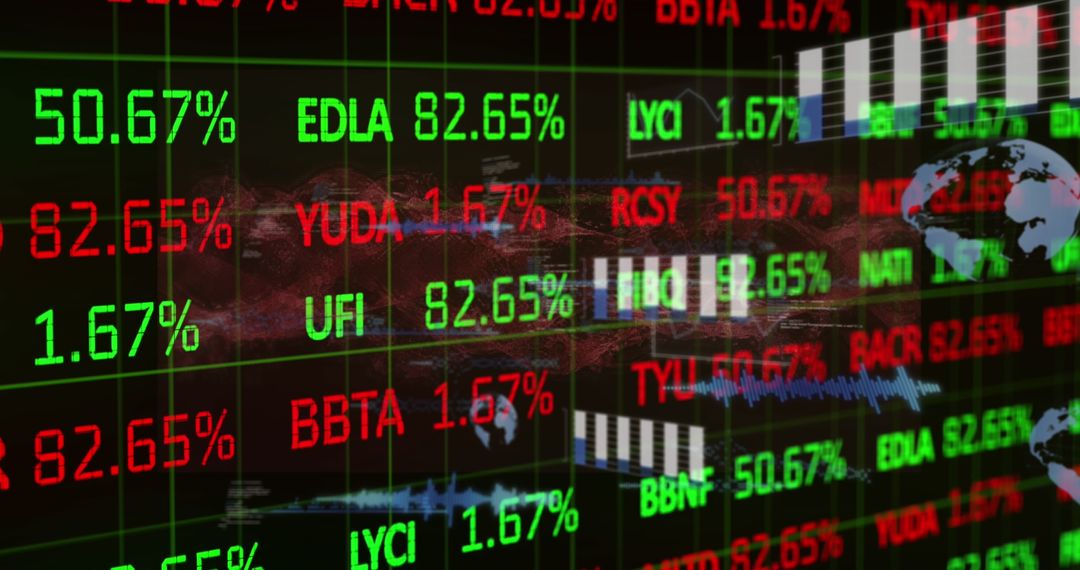
- Dynamic Financial Data Display in Neon Colors
Dynamic Financial Data Display in Neon Colors Image

Vibrant portrayal of financial data as neon numbers and graphics against black backdrop, reflecting intricate data processing within digital interface. Global business perspective conveyed through abstract illustrations. Suitable for illustrating financial reports, blog posts on digital finance innovations, or presentations on stock markets.
Powered by  - Get 15% off with code: PIKWIZARD15


2
downloads
downloads
Tags:
More
Credit Photo
If you would like to credit the Photo, here are some ways you can do so
Text Link
photo Link
<span class="text-link">
<span>
<a target="_blank" href=https://pikwizard.com/photo/dynamic-financial-data-display-in-neon-colors/a5b93bf6b06671661f96881c0f8a6d83/>PikWizard</a>
</span>
</span>
<span class="image-link">
<span
style="margin: 0 0 20px 0; display: inline-block; vertical-align: middle; width: 100%;"
>
<a
target="_blank"
href="https://pikwizard.com/photo/dynamic-financial-data-display-in-neon-colors/a5b93bf6b06671661f96881c0f8a6d83/"
style="text-decoration: none; font-size: 10px; margin: 0;"
>
<img src="https://pikwizard.com/pw/medium/a5b93bf6b06671661f96881c0f8a6d83.jpg" style="margin: 0; width: 100%;" alt="" />
<p style="font-size: 12px; margin: 0;">PikWizard</p>
</a>
</span>
</span>
Free (free of charge)
Free for personal and commercial use.
Author: Authentic Images
Similar Free Stock Images

Premium


Premium


Premium


Premium


Premium


Premium


Premium


Premium


Premium


Premium


Premium


Premium


Premium


Premium


Premium


Premium


Premium


Premium


Premium


Premium


Premium


Premium


Premium


Premium