1. Home > 
  2. Stock Photos > 
  3. Dynamic Financial Data Display on Office Background

Dynamic Financial Data Display on Office Background Image

Dynamic Financial Data Display on Office Background

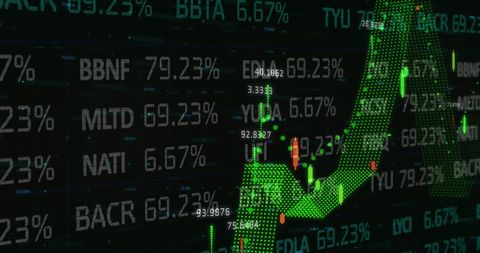
Digital visualization of financial data and changing numbers over office desk backdrop, symbolizing technology-driven finance industry. This depiction can illustrate financial market analysis, stock trading concepts, or a global business environment in presentations, marketing materials, and articles relating to modern finance trends or technology assimilation in business sectors.

Powered by Shutterstock logo - Get 15% off with code: PIKWIZARD15
Online trading, Investment, Strategy market plan, and Stock mark - Powered by Shutterstock - Get 15% off with code: PIKWIZARD15Business, finance and investment concept. Businessman using digital tablet analyzing and calculating financial data with economic graph growth chart, Business strategy and planning. market research - Powered by Shutterstock - Get 15% off with code: PIKWIZARD15Stock market analysis, business, finance and investment. Finance analyst analyzing stock market trading graph, economic growth chart, planning and strategy, business investment with financial report - Powered by Shutterstock - Get 15% off with code: PIKWIZARD15Two diverse crypto traders brokers stock exchange market investors discussing trading charts research reports growth using pc computer looking at screen analyzing invest strategy, financial risks. - Powered by Shutterstock - Get 15% off with code: PIKWIZARD15Stock market or forex trading graph in futuristic concept suitable for financial investment or Economic trends business idea and all art work design. Abstract finance background - Powered by Shutterstock - Get 15% off with code: PIKWIZARD15

Credit Photo

If you would like to credit the Photo, here are some ways you can do so

Free (free of charge)

Free for personal and commercial use.

Author: Creative Art

Similar Free Stock Images

3D Stock Market Graph in Digital Display
Premium
Happy middle aged business man ceo wearing suit standing in office using digital tablet. Smiling mature businessman professional executive manager looking away thinking working on tech device.
Advanced Financial Data Processing Chart Visualization
Digital Financial Data Processing on Notepad Screen
Digital Financial Data and Modern City Skyline Fusion
Dynamic Visualization of Financial Markets on Dark Background
Premium
Real estate, development and investing concept with financial chart indicators and stock market graphs on city skyscrapers tops bottom view, double exposure
Digital Interface Overlay on Financial Data with Server Room Background
Data Processing Digital Interface with Neon Graphs and Code
Stock Market Analytics with Abstract Finance Visuals
Digital Financial Data Streams Across Modern Cityscape
Premium
Stock market graph trading analysis investment financial, stock exchange financial or forex graph stock market graph chart business crisis crash loss and grow up gain and profits win up trend
Global Finance Abstract with Digital World Map Overlay
Global Business Data Analytics on World Map
Financial Data Analytics with Urban Skyline Backdrop
Digital Financial Data Processing in Urban Business Environment
Premium
Investors analyze graph data stock market index via digital tablet screen to trade the stock chart for planning investments take profit, trade stock exchange market and cryptocurrency data, financial.
Dynamic Stock Market Data and Analytical Graph Interfaces
Digital Data With Eco Icons Highlighting Environmental Impact
Digital Notifications and Holographic Data Visualization
Financial Data Overlay on Diverse Team Discussing in Office
Premium
Analyzing data. Close-up of young businessman pointing on the data presented in the chart with pen while working in creative office
Rising Global Markets Trend with Data Visualization
Financial Statistics Overlay in Modern Office Interior
Dynamic Digital Graphs and Data Points on Abstract Background
Digital Financial Statistics and Data Over Dark Background
Premium
Developing new approaches. Rear view of young man in casual wear holding hand on the back of the head and working while sitting at the desk in creative office
Social Media Alerts Overlaying Financial Market Trends
Global Financial Data Overlaid on Blurred City Lights
Digital Analytics Display Over Retail Environment
Abstract Digital Data Interface and Global Business Analytics
Global Financial Data on World Map with Digital Graphics
Dynamic Financial Growth with Digital Graph Layers
Premium
Stock market graph trading analysis investment financial, stock exchange financial or forex graph stock market graph chart business crisis crash loss and grow up gain and profits win up trend.
Digital Financial Data Processing Concept
Digital Financial Display over Urban Skyscrapers
Digital Financial Data Display with Graphs and Metrics
Financial Data and Charts Overlay Cityscape Illustrating Global Economy
Premium
Analyst working with Financial Data and Business Analytics Dashboard on computer to make Financial Report with KPI and Metrics. Investment, Corporate Finance, Strategy, Operations, Sales.
Dynamic Financial Data with Abstract Stock Market Graphs
Global Financial Data Overlaying Metropolitan Skyline
Financial Trade Graph Bar Chart on Cityscape Skyline View
Global Stock Market Graph on a Digital World Map
Premium
Analysis finance grow graph and market  investment. Financial  business plan,earnings,sale and strategy. Stock market chart, exchange financial growth diagram.
Stock Market Analysis with Digital Data Visualization
Digital Data Infographic Detail with Data Points and Graphs
Financial Data Visualization Against City Skyline
Digital Interface Showing Data Protection and Financial Trends
Premium
Businessman using mobile smart phone. Business global internet connection application technology and digital marketing, Financial and banking, Digital link tech, big data.
Stock Market Analysis on Modern Digital Interface
Digital Data Visualization with Financial Analytics and Metrics
Abstract Financial Data Processing Visualization in Digital Environment
Abstract Financial Data Visualization on Digital Screen with World Map
Premium
Businesswomen use magnifier glass find stock in stock markets, uptrends, growth economics, business strategy development, and opportunities for investment, take profit from funds, Financial Analyst.
Digital Stock Market Data with Fluctuating Numbers and Graphs
Digital Analytics and Financial Data Over Urban Skyline
Dynamic Financial Data Visualization on Blue Background
Financial Data Analytics and Global Cityscape with Futuristic Display
Premium
Increase in electricity prices on the world market. Green energy in full development.Investment finance chart,stock market business and exchange financial growth graph.
Businessman Analyzing Financial Data with Graphs in Office
Digital Financial Data Displayed Over Retail Shelves
Futuristic 3D Green Waveform Display on Trading Application
Financial Data Over World Map Interfacing with Digital Connections
Digital Forex Data Visualization with Growing Trend
Dynamic Stock Market Display with Rising Chart
Premium
Businessman Drawing Upward Arrow on Digital Stock Market Graph with Trading Data, Buy and Sell Indicators, Representing Financial Growth, Investment Success Foreign currency trading and Forex Trading
Digital Financial Graphs and Data in Motion
Dynamic Financial Graphs Overlooking Global Cityscape
Dynamic Financial Graphs Over City Background
Digital Data Analysis with Financial Graphs Interface
Premium
Stock market exchange loss trading graph analysis investment indicator business graph charts of financial board display candlestick crisis stock crash red price chart fall money
Dynamic Stock Market Data Overlayed on Skyscrapers
Colorful Graph Displaying Stock Market Trends on Digital Grid
Digital Global Stock Market Analysis Over World Map
Abstract Financial Data Visualization in Modern Office
Premium
Stock market graph trading analysis investment financial, stock exchange financial or forex graph stock market graph chart business crisis crash loss and grow up gain and profits win up trend
Digital Data Visualization with Dynamic Stock Market Charts
Digital Fluorescent Data Visuals Overlapping Cityscape Silhouette
Digital Graph Showing Data Processing on Dark Tech Background
Businesswoman Amid Statistical Data in Modern Office Environment
Premium
Asia real estate sale agent, stock market trader woman work at bank office talk in tax plan report. Lawyer help ask or advice lease on laptop desk typing fund loan data. Smile happy trust in HR job.
Digital Financial Data and Cyber Technology Concept
Digital Interface with Financial Data Visualizations
Financial Data Across Global Digital Network
Dynamic Financial Data on Orange Background
Premium
Businessman using KPI dashboard.Financial business KPI System data analytics graph dashboard.Data System KPI and metrics connected in database for follow earnings,operations and sales data.
Digital Financial Data Processing with Global Connectivity
Digital Financial Data Overlay on Modern Office Interior
Digital Financial Data Analytics Chart Performance
Financial Data Visualization with Binary Coding in Green-Blue Palette
Premium
Stock market or forex trading graph on touchscreen,  finance and investment concept. Economy trends for business, financial charts and digits.
Financial Data Visualization with Green Graph and Numbers
Upward Trending Green Dotted Arrow on Glass Facade With Candlestick Bars
Financial Data Visualization Over Empty Office Scene
Global Financial Data Overlay on World Map in Office Atmosphere
Global Finance Panning over City Traffic Lights
Digital Financial Data and Market Analytics Concept
Premium
Businessman works on laptop Showing business analytics dashboard with charts, metrics, and KPI to analyze performance and create insight reports for operations management. Data analysis concept.Ai
Dynamic Financial Data Over Futuristic Building Render
Data Processing and Global Business Digital Visualization
Digital Data Processing with Graphs and Coding Visualization
Dynamic Financial Data Processed Amid City Lights at Night
Premium
Businessman analyzing forex trading graph financial data. Stock Market Investments Funds and Digital Assets. Business finance technology and investment concept. Business finance background.
Advanced Digital Graph Illustrating Stock Market Trends
Global Financial Data Overlay with Vibrant Graphs on World Map
Inflation Concept with Digital Data Indicators
Floating Business Figures in Digital Finance Display
Premium
Stock exchange market graph analysis background
Digital Financial Data Technicolor Motion Chart
Global Finance Graphics Showing Market Data on World Map
Financial Data Overlay on Cityscape Technology Concept
World Map Overlay with Financial Data and City Lights
Premium
Young indian business man trader wearing glasses looking at computer screen with trading charts reflecting in eyeglasses watching stock trading market financial data growth concept, close up.
Global Financial Data Analysis with Digital Graphics
Financial Data Illustration on City Skyline Background
Dynamic Financial Data Visualization with Holographic Numbers
Abstract Financial Data on Blue Digital Background
Premium
Businessman using laptop computer analyzing sales data and financial growth graph chart report. Business planning, strategy and development. Financial accounting. market research, data analysis
Futuristic Financial Data Display Over Cityscape
Dynamic Financial Data Visualization with Digital Interface
Digital Icons Over Financial Data on Black Background
Digital Interface Overlaid on Retail Environments Reflecting Market Data
Premium
Analyst working with Financial Report and Business Analytics Dashboard on laptop computer to analyze Financial Data with KPI and Metrics. Investment, Operations, Sales, Corporate Finance, Strategy.
Futuristic financial data visualizing neon candlesticks and dotted peaks over world map