
- Home >
- Stock Photos >
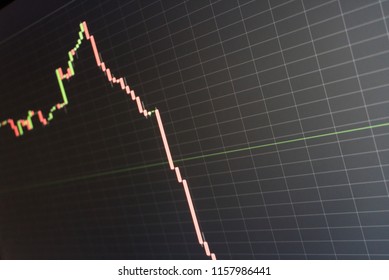
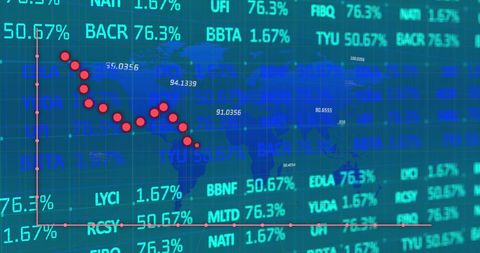
- Dynamic Financial Data Display with Declining Graph Visualization
Dynamic Financial Data Display with Declining Graph Visualization Image

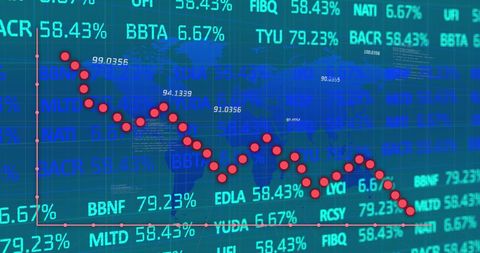
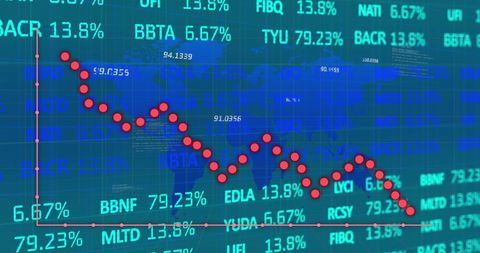
Digital screen presenting financial data with an emphasis on twelve-month assessments, surrounding components arranged diagonally. Background triangle shows sequential leader responses as comparison progressions. Muted colors for secondary parts. Ideal for uses in financial reports, analysis presentations, investment tracking, portraying data visualization scenarios.
Powered by  - Get 15% off with code: PIKWIZARD15


downloads
Tags:
More
Credit Photo
If you would like to credit the Photo, here are some ways you can do so
Text Link
photo Link
<span class="text-link">
<span>
<a target="_blank" href=https://pikwizard.com/photo/dynamic-financial-data-display-with-declining-graph-visualization/5d19b6d4727b9a6122d4d756ce8e5720/>PikWizard</a>
</span>
</span>
<span class="image-link">
<span
style="margin: 0 0 20px 0; display: inline-block; vertical-align: middle; width: 100%;"
>
<a
target="_blank"
href="https://pikwizard.com/photo/dynamic-financial-data-display-with-declining-graph-visualization/5d19b6d4727b9a6122d4d756ce8e5720/"
style="text-decoration: none; font-size: 10px; margin: 0;"
>
<img src="https://pikwizard.com/pw/medium/5d19b6d4727b9a6122d4d756ce8e5720.jpg" style="margin: 0; width: 100%;" alt="" />
<p style="font-size: 12px; margin: 0;">PikWizard</p>
</a>
</span>
</span>
Free (free of charge)
Free for personal and commercial use.
Author: Creative Art
Similar Free Stock Images

Premium


Premium


Premium


Premium


Premium


Premium


Premium

Premium


Premium


Premium


Premium

Premium


Premium

Premium

Premium


Premium


Premium


Premium

Premium


Premium


Premium

Premium


Premium


Premium


Premium


Explore More Free Stock Images