
- Home >
- Stock Photos >
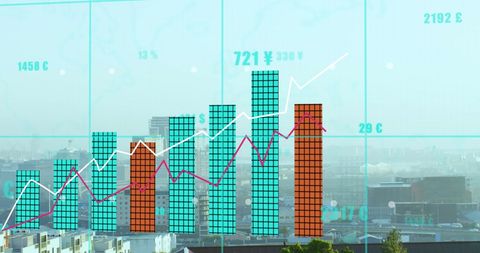
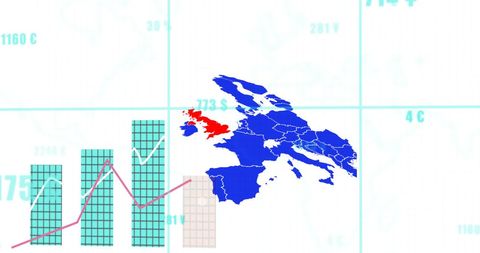
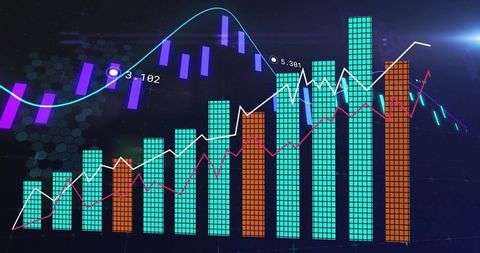
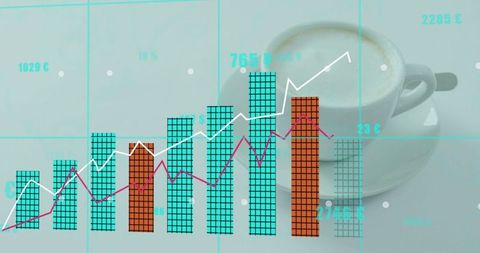
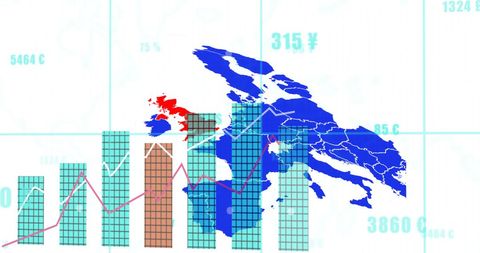
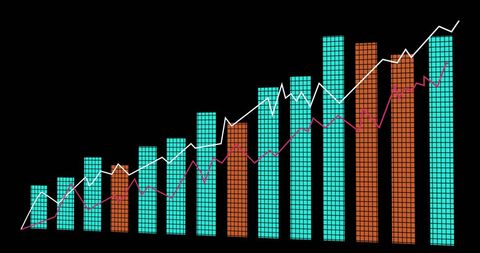
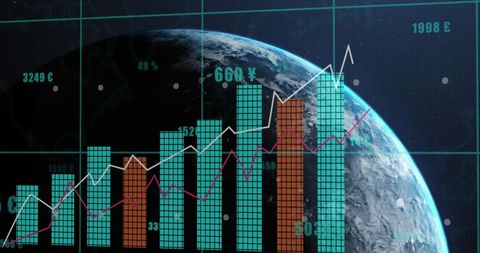
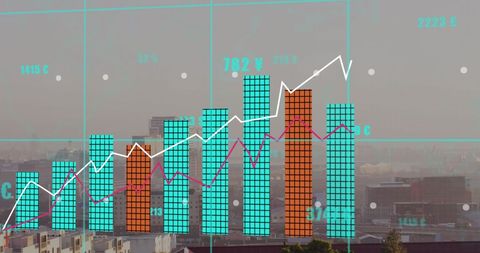
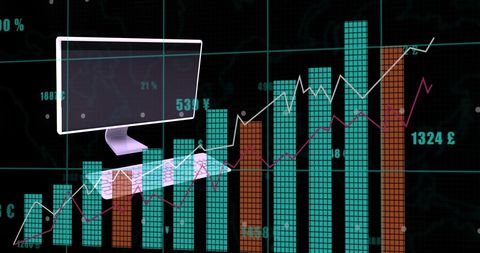
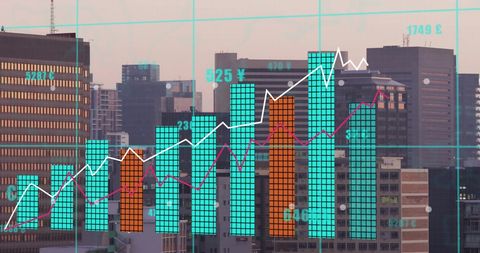
- Dynamic Financial Data Display with Global Indicators
Dynamic Financial Data Display with Global Indicators Image

Visualization of financial data showing bar and line graphs with global currency indicators set against a technological background. Suitable for illustrating global market trends or finance articles. Ideal for business presentations, financial reports, and fintech content.
Powered by 


downloads
Tags:
More
Credit Photo
If you would like to credit the Photo, here are some ways you can do so
Text Link
photo Link
<span class="text-link">
<span>
<a target="_blank" href=https://pikwizard.com/photo/dynamic-financial-data-display-with-global-indicators/d1ea9b6342c6799276140f21ae0b05bd/>PikWizard</a>
</span>
</span>
<span class="image-link">
<span
style="margin: 0 0 20px 0; display: inline-block; vertical-align: middle; width: 100%;"
>
<a
target="_blank"
href="https://pikwizard.com/photo/dynamic-financial-data-display-with-global-indicators/d1ea9b6342c6799276140f21ae0b05bd/"
style="text-decoration: none; font-size: 10px; margin: 0;"
>
<img src="https://pikwizard.com/pw/medium/d1ea9b6342c6799276140f21ae0b05bd.jpg" style="margin: 0; width: 100%;" alt="" />
<p style="font-size: 12px; margin: 0;">PikWizard</p>
</a>
</span>
</span>
Free (free of charge)
Free for personal and commercial use.
Author: Authentic Images
Similar Free Stock Images

Premium


Premium


Premium


Premium

Premium


Premium

Premium

Premium


Premium


Premium


Premium


Premium

Premium


Premium


Premium

Premium


Premium


Premium


Premium


Premium


Premium


Premium


Premium


Premium


Premium


Explore More Free Stock Images