- Home >
- Stock Photos >
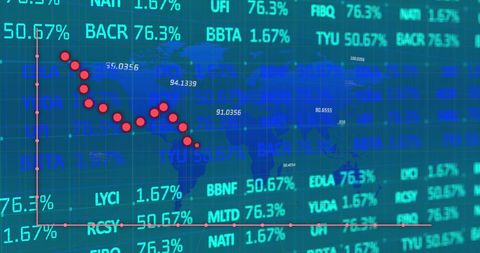
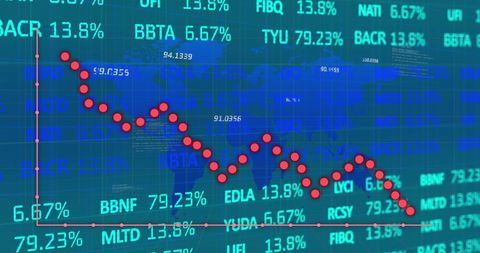
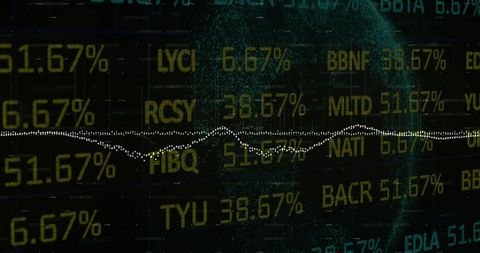
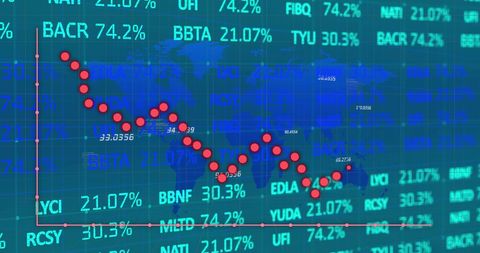
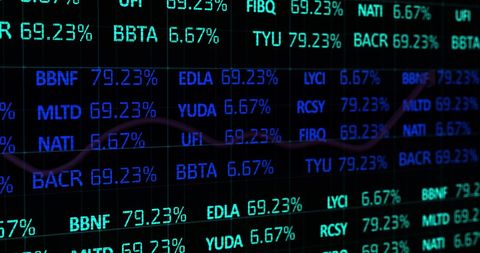
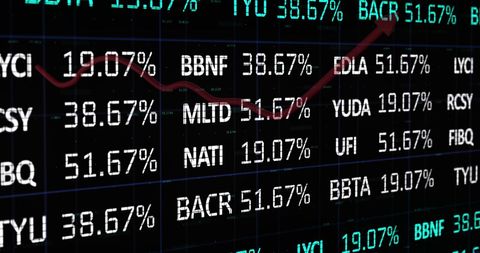
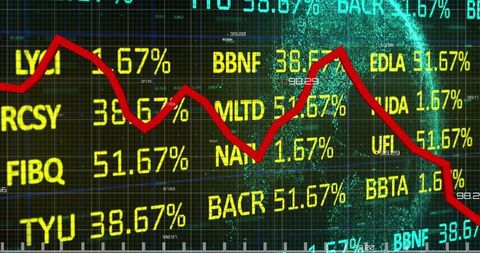
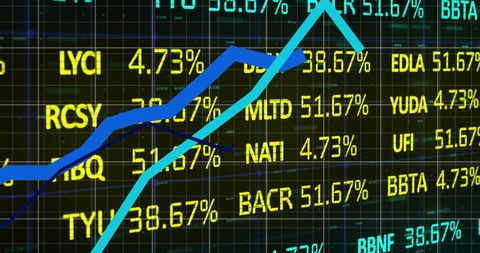
- Dynamic Financial Data Display with Global Networking Theme
Dynamic Financial Data Display with Global Networking Theme Image

Engaging display of financial data processing with a global theme, showcasing fluctuating stock market trends through bright colors. Useful for presentations on global finance, data analytics, or virtual security solutions, appealing to business and technology industries.

downloads
Tags:
More
Credit Photo
If you would like to credit the Photo, here are some ways you can do so
Text Link
photo Link
<span class="text-link">
<span>
<a target="_blank" href=https://pikwizard.com/photo/dynamic-financial-data-display-with-global-networking-theme/6f2754a8b2c0da989aabcc14ed2c664c/>PikWizard</a>
</span>
</span>
<span class="image-link">
<span
style="margin: 0 0 20px 0; display: inline-block; vertical-align: middle; width: 100%;"
>
<a
target="_blank"
href="https://pikwizard.com/photo/dynamic-financial-data-display-with-global-networking-theme/6f2754a8b2c0da989aabcc14ed2c664c/"
style="text-decoration: none; font-size: 10px; margin: 0;"
>
<img src="https://pikwizard.com/pw/medium/6f2754a8b2c0da989aabcc14ed2c664c.jpg" style="margin: 0; width: 100%;" alt="" />
<p style="font-size: 12px; margin: 0;">PikWizard</p>
</a>
</span>
</span>
Free (free of charge)
Free for personal and commercial use.
Author: Awesome Content