- Home >
- Stock Photos >
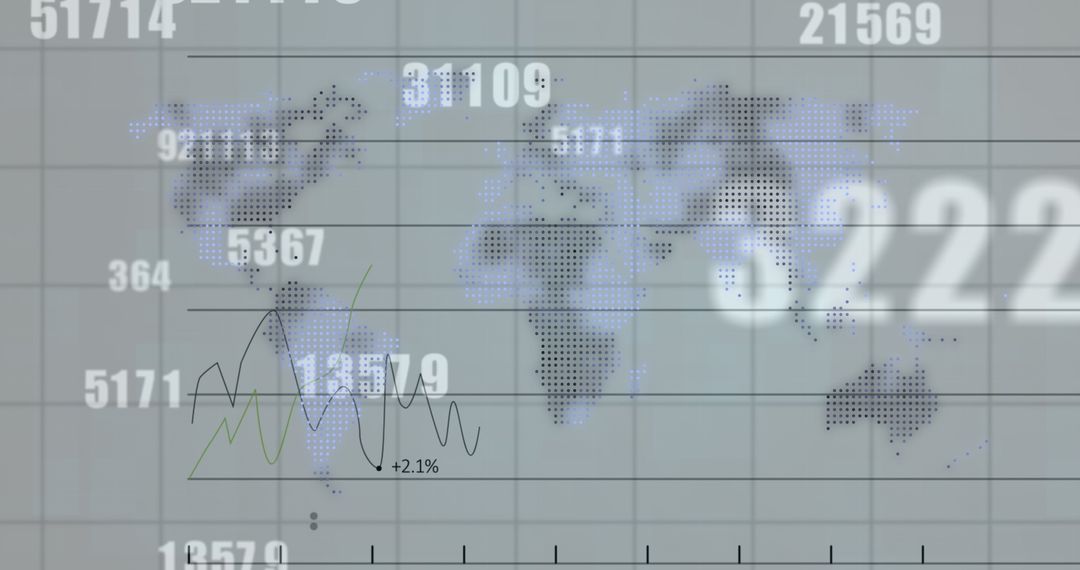
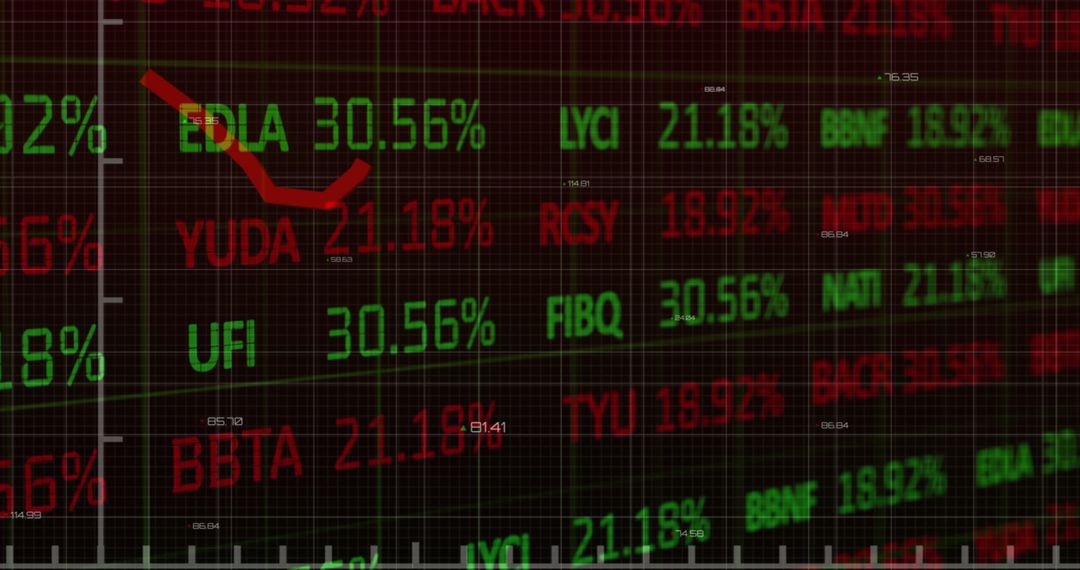
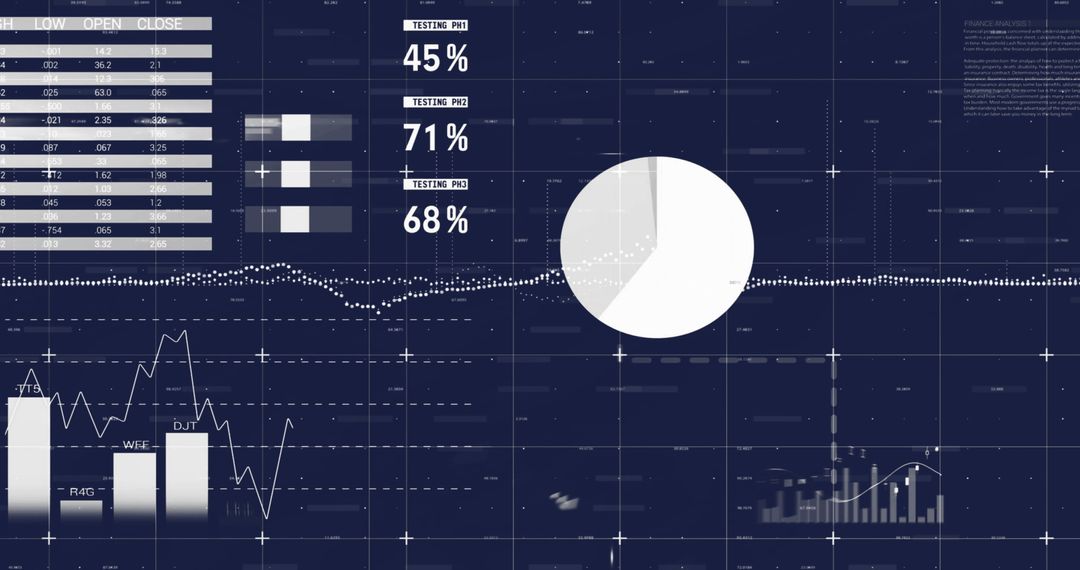
- Dynamic Financial Data Display with Growth Charts and Symbols
Dynamic Financial Data Display with Growth Charts and Symbols Image

Depicting a digital interface filled with financial graphs and statistics, this scene showcases concepts of global finance and economic growth. Useful in presentations about economic analysis, financial reports, or illustrating trends in business articles and studies.
Powered by  - Get 15% off with code: PIKWIZARD15


0
downloads
downloads
Tags:
More
Credit Photo
If you would like to credit the Photo, here are some ways you can do so
Text Link
photo Link
<span class="text-link">
<span>
<a target="_blank" href=https://pikwizard.com/photo/dynamic-financial-data-display-with-growth-charts-and-symbols/b7d44916ceb39c493313a5826b4922a8/>PikWizard</a>
</span>
</span>
<span class="image-link">
<span
style="margin: 0 0 20px 0; display: inline-block; vertical-align: middle; width: 100%;"
>
<a
target="_blank"
href="https://pikwizard.com/photo/dynamic-financial-data-display-with-growth-charts-and-symbols/b7d44916ceb39c493313a5826b4922a8/"
style="text-decoration: none; font-size: 10px; margin: 0;"
>
<img src="https://pikwizard.com/pw/medium/b7d44916ceb39c493313a5826b4922a8.jpg" style="margin: 0; width: 100%;" alt="" />
<p style="font-size: 12px; margin: 0;">PikWizard</p>
</a>
</span>
</span>
Free (free of charge)
Free for personal and commercial use.
Author: Awesome Content
Similar Free Stock Images
Premium


Premium


Premium


Premium


Premium


Premium


Premium


Premium


Premium


Premium


Premium


Premium


Premium


Premium


Premium


Premium


Premium


Premium


Premium


Premium


Premium


Premium


Premium


Premium