- Home >
- Stock Photos >
- Dynamic Financial Data Display with Interactive Graphs and Charts
Dynamic Financial Data Display with Interactive Graphs and Charts Image

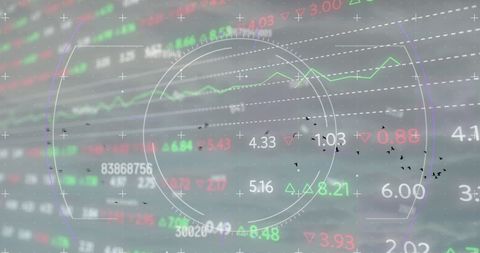
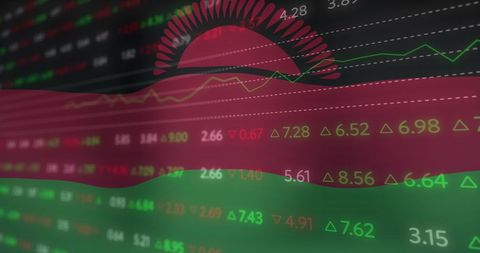
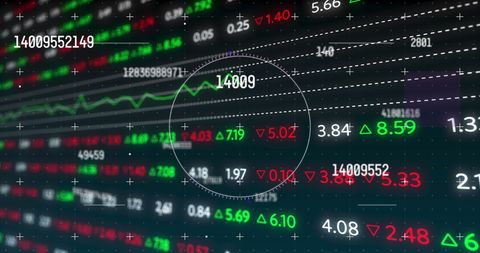
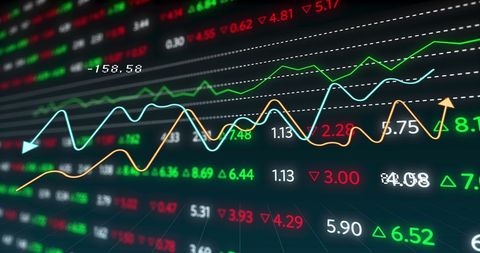
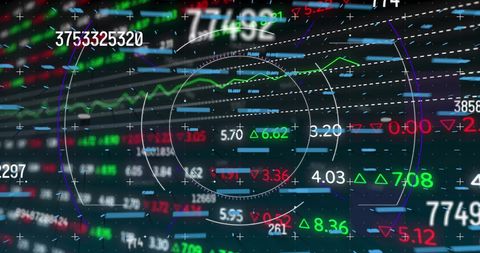
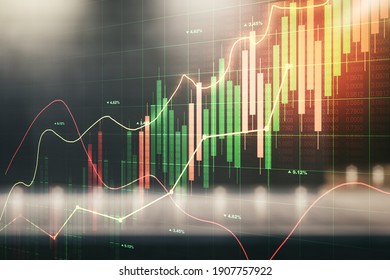
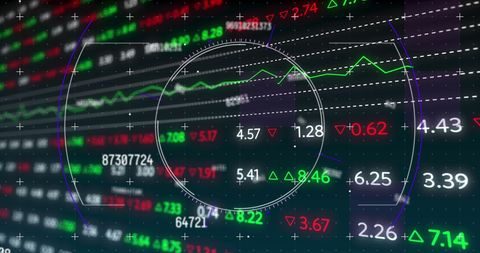
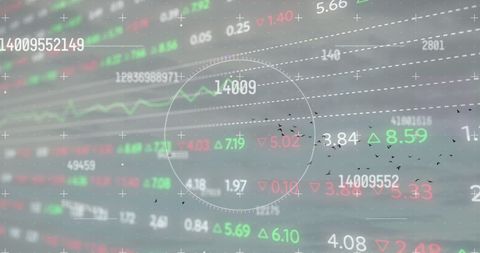
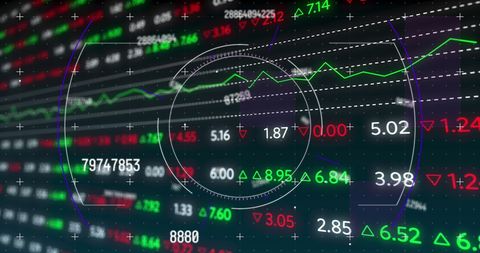
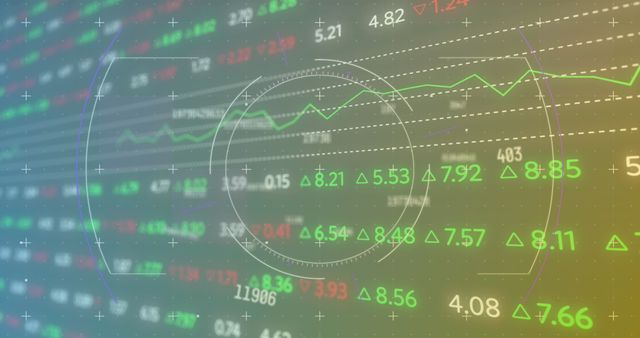
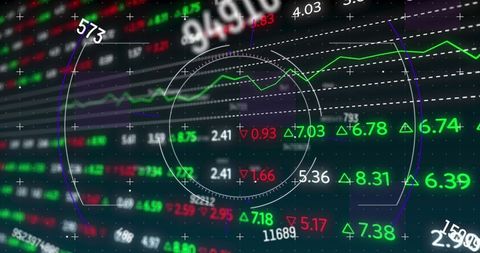
This engaging visual showcases dynamic financial graphs and charts on a vibrant digital background. Perfect for finance-related topics, it can be used to depict stock market analytics, economic trends, investment strategies, and the evolution of financial technology. Ideal for presentations, blog posts, reports, and articles focused on finance, trading, or predictive data models.
Powered by  - Get 15% off with code: PIKWIZARD15


downloads
Tags:
More
Credit Photo
If you would like to credit the Photo, here are some ways you can do so
Text Link
photo Link
<span class="text-link">
<span>
<a target="_blank" href=https://pikwizard.com/photo/dynamic-financial-data-display-with-interactive-graphs-and-charts/36aa5d512ca80be9311427e0258a9059/>PikWizard</a>
</span>
</span>
<span class="image-link">
<span
style="margin: 0 0 20px 0; display: inline-block; vertical-align: middle; width: 100%;"
>
<a
target="_blank"
href="https://pikwizard.com/photo/dynamic-financial-data-display-with-interactive-graphs-and-charts/36aa5d512ca80be9311427e0258a9059/"
style="text-decoration: none; font-size: 10px; margin: 0;"
>
<img src="https://pikwizard.com/pw/medium/36aa5d512ca80be9311427e0258a9059.jpg" style="margin: 0; width: 100%;" alt="" />
<p style="font-size: 12px; margin: 0;">PikWizard</p>
</a>
</span>
</span>
Free (free of charge)
Free for personal and commercial use.
Author: People Creations
Similar Free Stock Images
Loading...

Premium


Premium

Premium


Premium

Premium


Premium


Premium


Premium


Premium

Premium


Premium

Premium


Premium

Premium


Premium


Premium

Premium


Premium


Premium


Premium

Premium

Premium

Premium


Premium


Premium