- Home >
- Stock Photos >
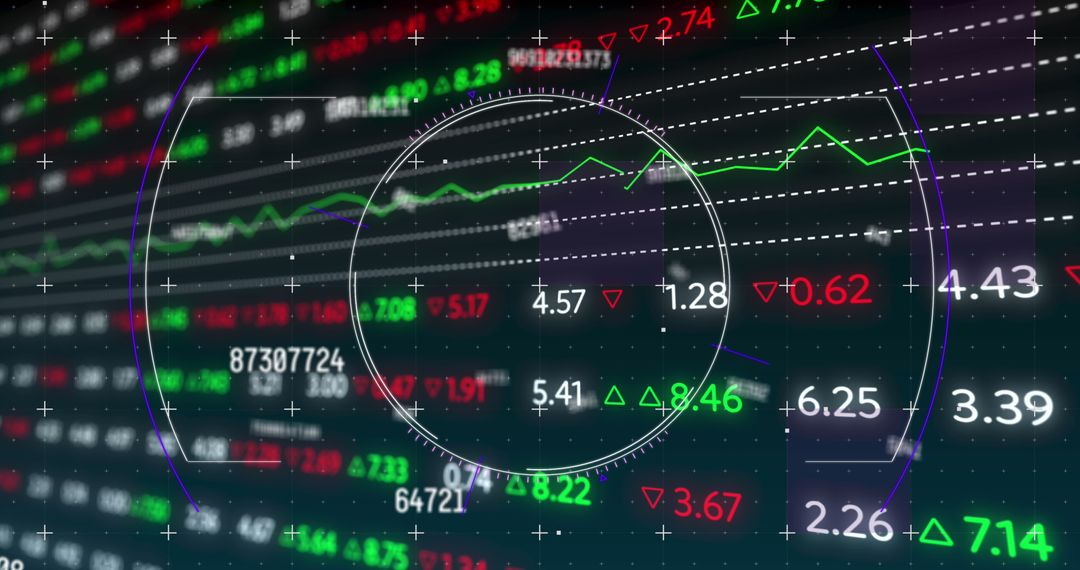
- Dynamic Financial Data Display with Line Graphs and Stock Prices
Dynamic Financial Data Display with Line Graphs and Stock Prices Image

Displaying fluctuating stock prices and data in a digital interface. Ideal for illustrating concepts in finance, market analysis, global trading, investment strategy, or economic research. Suitable for presentations, reports, financial news, and educational materials about stock markets and financial technology.
Powered by  - Get 15% off with code: PIKWIZARD15


5
downloads
downloads
Tags:
More
Credit Photo
If you would like to credit the Photo, here are some ways you can do so
Text Link
photo Link
<span class="text-link">
<span>
<a target="_blank" href=https://pikwizard.com/photo/dynamic-financial-data-display-with-line-graphs-and-stock-prices/c04328d17bd7363fbef864644a4f7b74/>PikWizard</a>
</span>
</span>
<span class="image-link">
<span
style="margin: 0 0 20px 0; display: inline-block; vertical-align: middle; width: 100%;"
>
<a
target="_blank"
href="https://pikwizard.com/photo/dynamic-financial-data-display-with-line-graphs-and-stock-prices/c04328d17bd7363fbef864644a4f7b74/"
style="text-decoration: none; font-size: 10px; margin: 0;"
>
<img src="https://pikwizard.com/pw/medium/c04328d17bd7363fbef864644a4f7b74.jpg" style="margin: 0; width: 100%;" alt="" />
<p style="font-size: 12px; margin: 0;">PikWizard</p>
</a>
</span>
</span>
Free (free of charge)
Free for personal and commercial use.
Author: Authentic Images
Similar Free Stock Images

Premium


Premium


Premium


Premium


Premium


Premium


Premium


Premium


Premium


Premium


Premium


Premium


Premium


Premium


Premium


Premium


Premium


Premium


Premium


Premium


Premium


Premium


Premium


Premium