- Home >
- Stock Photos >
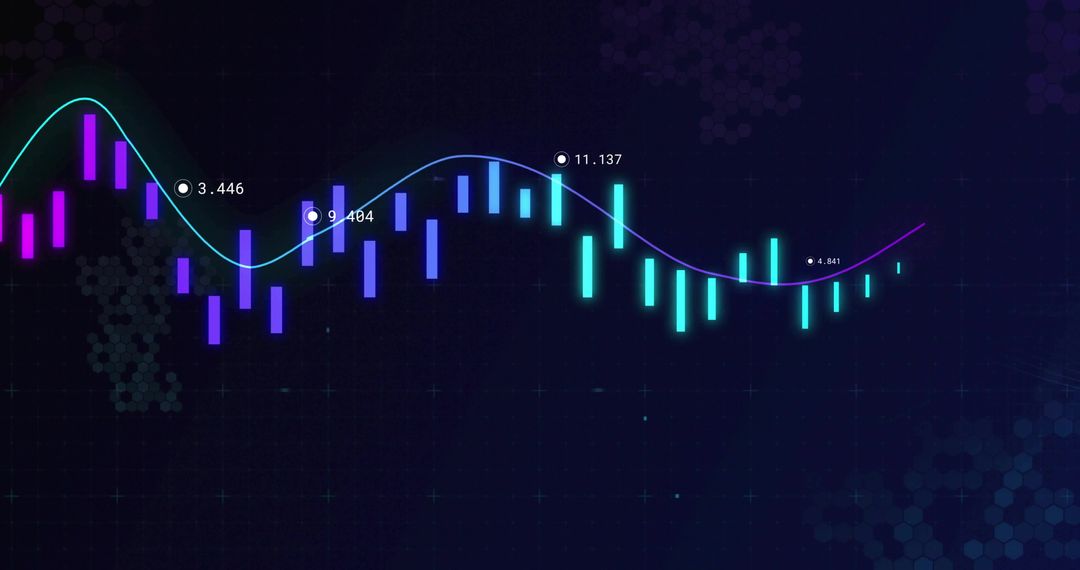
- Dynamic Financial Data Display with Market Trends
Dynamic Financial Data Display with Market Trends Image

This visualization showcases dynamic financial data processing, featuring fluctuating charts symbolizing market trends. The blend of green and red bars indicates various trading activities, appealing to investors and business analysts. Ideal for financial presentations, economic reports, and digital business platforms aiming to convey complex financial landscapes. It is useful for background imagery in sectors related to finance, investing, and global market analytics.
Powered by  - Get 15% off with code: PIKWIZARD15


2
downloads
downloads
Tags:
More
Credit Photo
If you would like to credit the Photo, here are some ways you can do so
Text Link
photo Link
<span class="text-link">
<span>
<a target="_blank" href=https://pikwizard.com/photo/dynamic-financial-data-display-with-market-trends/66af0f9a6231cea6e97a404ca9d494c2/>PikWizard</a>
</span>
</span>
<span class="image-link">
<span
style="margin: 0 0 20px 0; display: inline-block; vertical-align: middle; width: 100%;"
>
<a
target="_blank"
href="https://pikwizard.com/photo/dynamic-financial-data-display-with-market-trends/66af0f9a6231cea6e97a404ca9d494c2/"
style="text-decoration: none; font-size: 10px; margin: 0;"
>
<img src="https://pikwizard.com/pw/medium/66af0f9a6231cea6e97a404ca9d494c2.jpg" style="margin: 0; width: 100%;" alt="" />
<p style="font-size: 12px; margin: 0;">PikWizard</p>
</a>
</span>
</span>
Free (free of charge)
Free for personal and commercial use.
Author: Authentic Images
Similar Free Stock Images

Premium


Premium


Premium


Premium


Premium


Premium


Premium


Premium


Premium


Premium


Premium


Premium


Premium


Premium


Premium


Premium


Premium


Premium


Premium


Premium


Premium


Premium


Premium


Premium