- Home >
- Stock Photos >
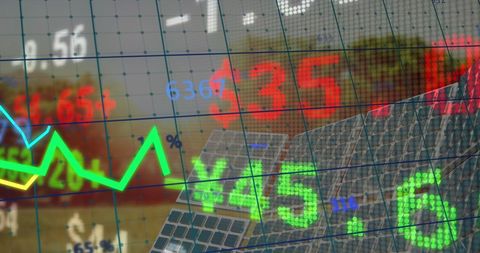
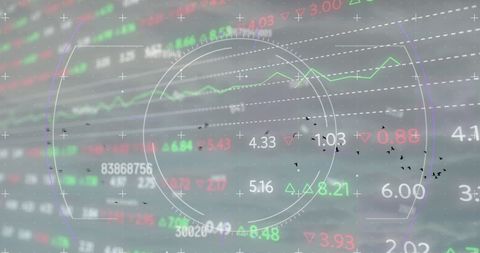
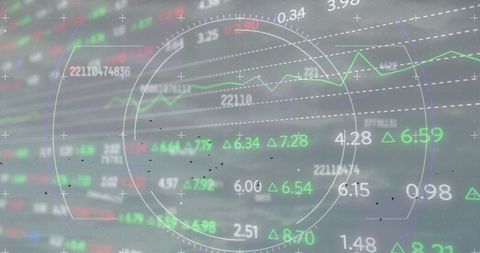
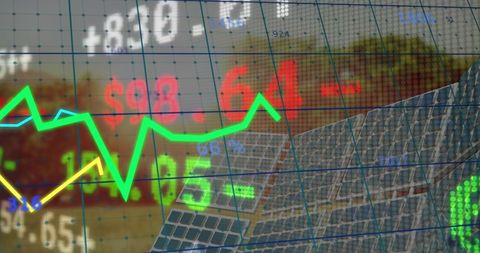
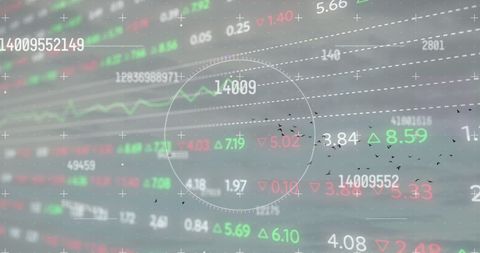
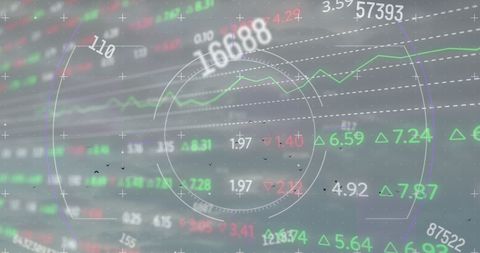
- Dynamic Financial Data Display with Moving Graph Lines
Dynamic Financial Data Display with Moving Graph Lines Image

This image shows dynamic financial data with moving graph lines on a digital display. It emphasizes global finance and real-time market analysis. Ideal for use in articles, presentations, or websites related to finance, stock trading insights, and data visualization.

downloads
Tags:
More
Credit Photo
If you would like to credit the Photo, here are some ways you can do so
Text Link
photo Link
<span class="text-link">
<span>
<a target="_blank" href=https://pikwizard.com/photo/dynamic-financial-data-display-with-moving-graph-lines/49a4a15b83ea7e575c838a72b43132b8/>PikWizard</a>
</span>
</span>
<span class="image-link">
<span
style="margin: 0 0 20px 0; display: inline-block; vertical-align: middle; width: 100%;"
>
<a
target="_blank"
href="https://pikwizard.com/photo/dynamic-financial-data-display-with-moving-graph-lines/49a4a15b83ea7e575c838a72b43132b8/"
style="text-decoration: none; font-size: 10px; margin: 0;"
>
<img src="https://pikwizard.com/pw/medium/49a4a15b83ea7e575c838a72b43132b8.jpg" style="margin: 0; width: 100%;" alt="" />
<p style="font-size: 12px; margin: 0;">PikWizard</p>
</a>
</span>
</span>
Free (free of charge)
Free for personal and commercial use.
Author: Authentic Images