
- Home >
- Stock Photos >
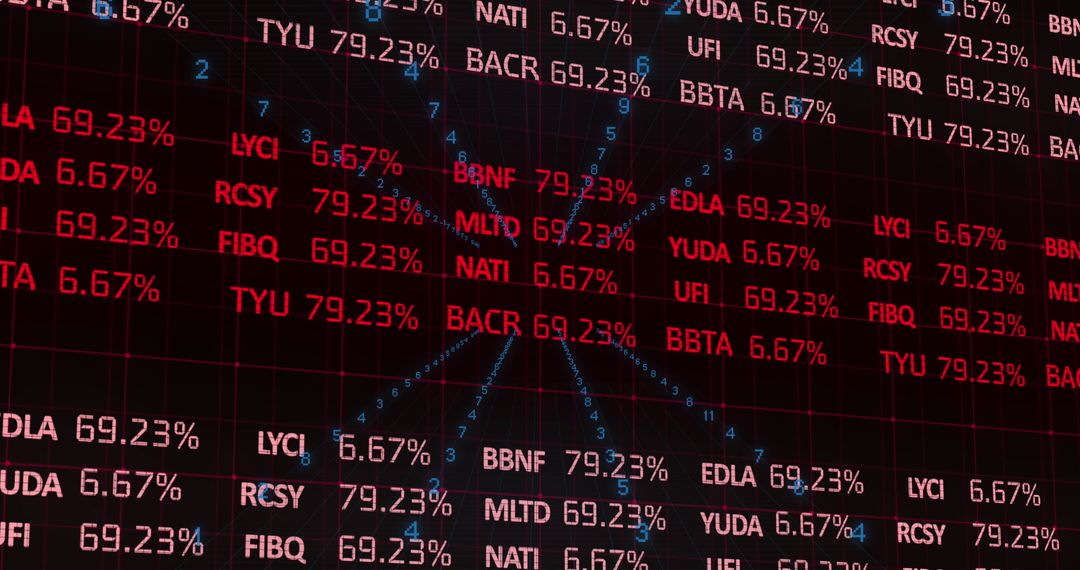
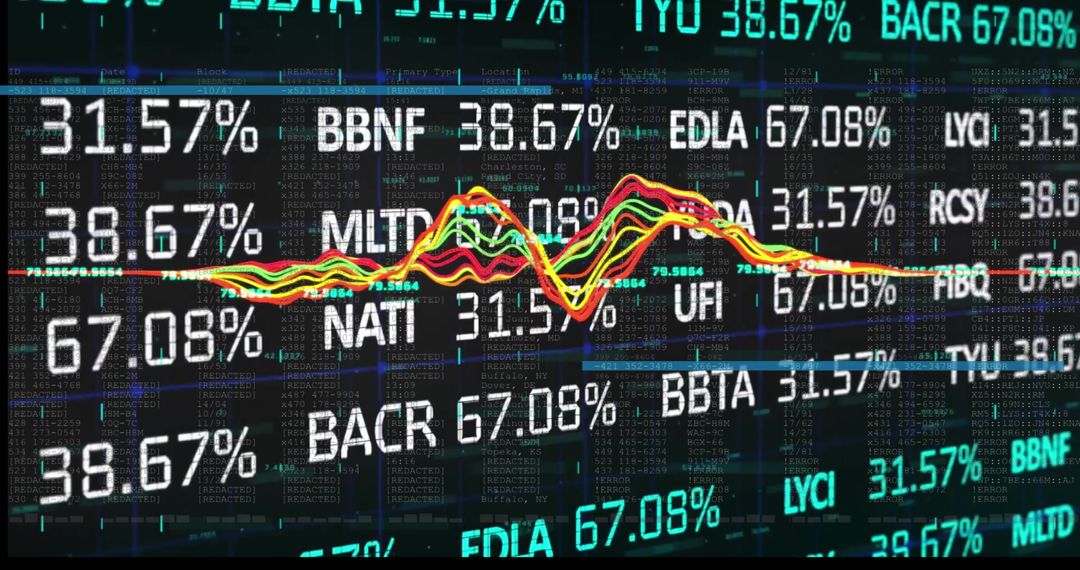
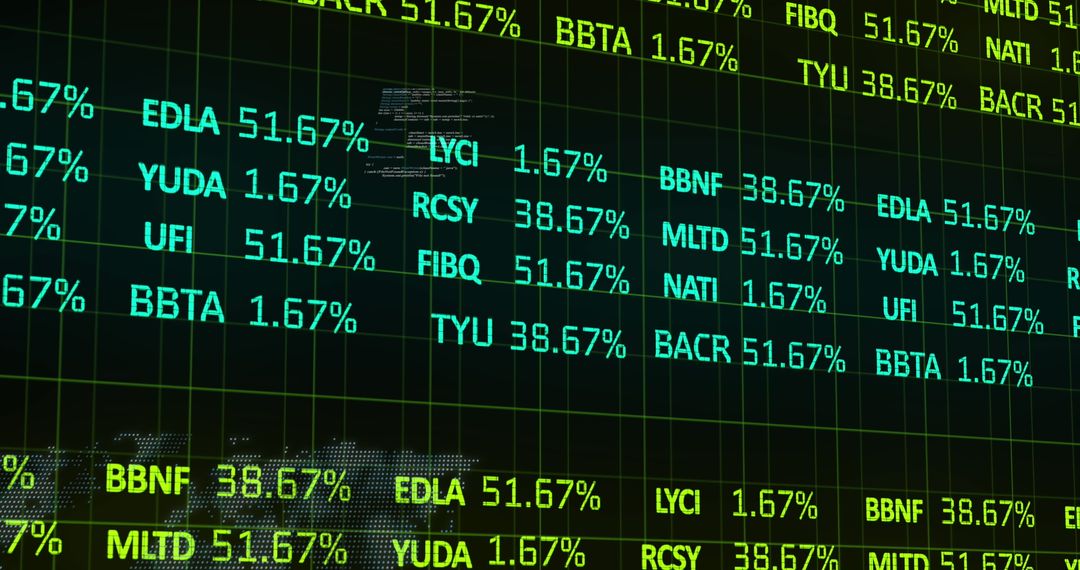
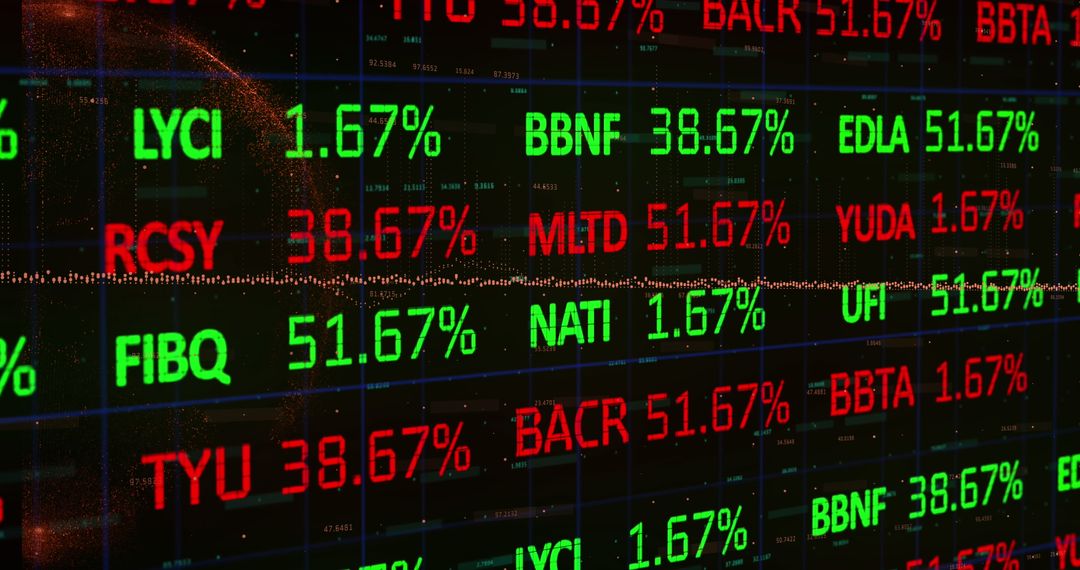
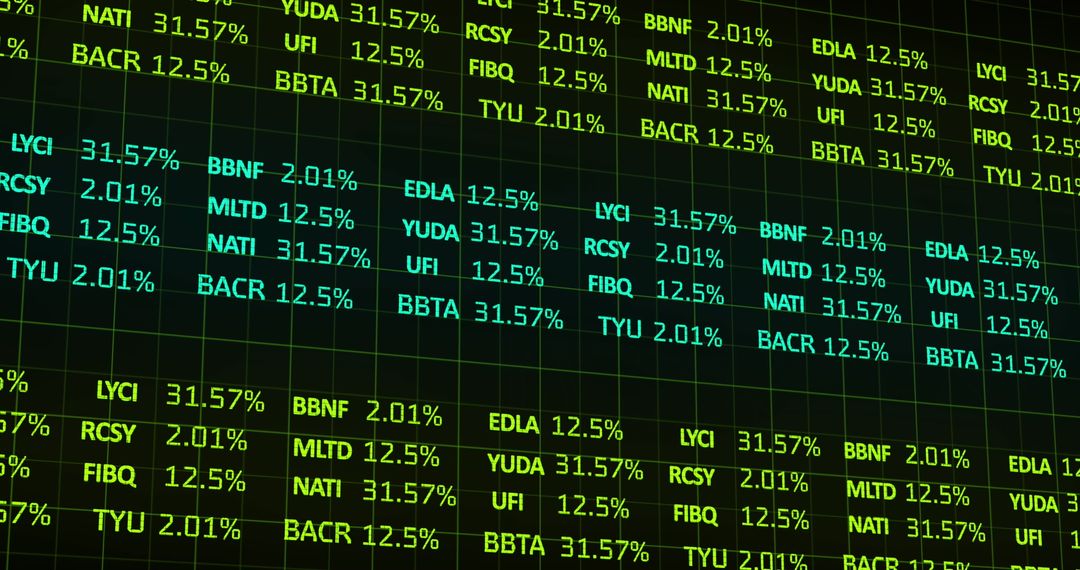
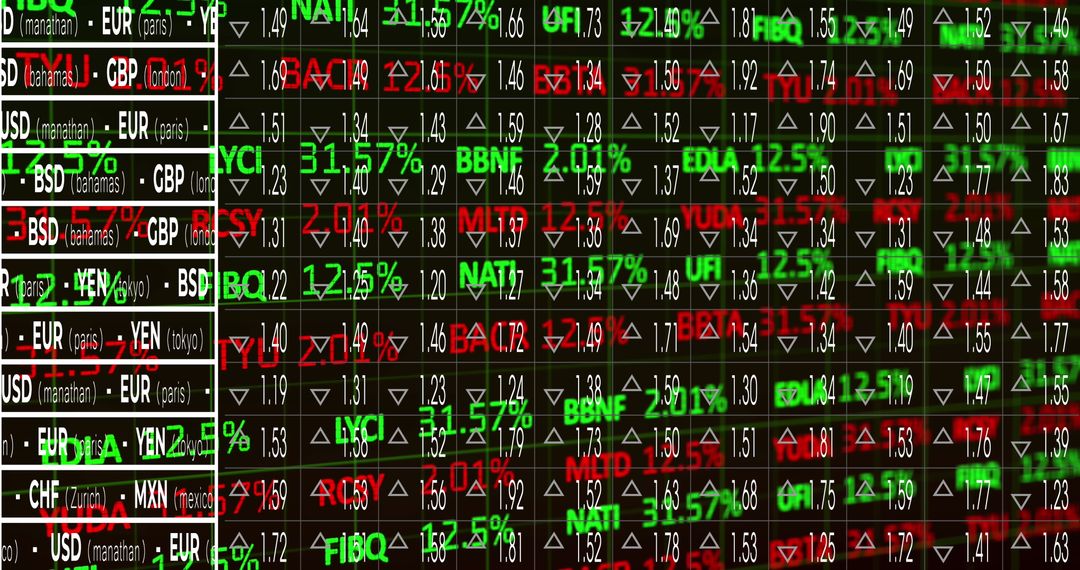
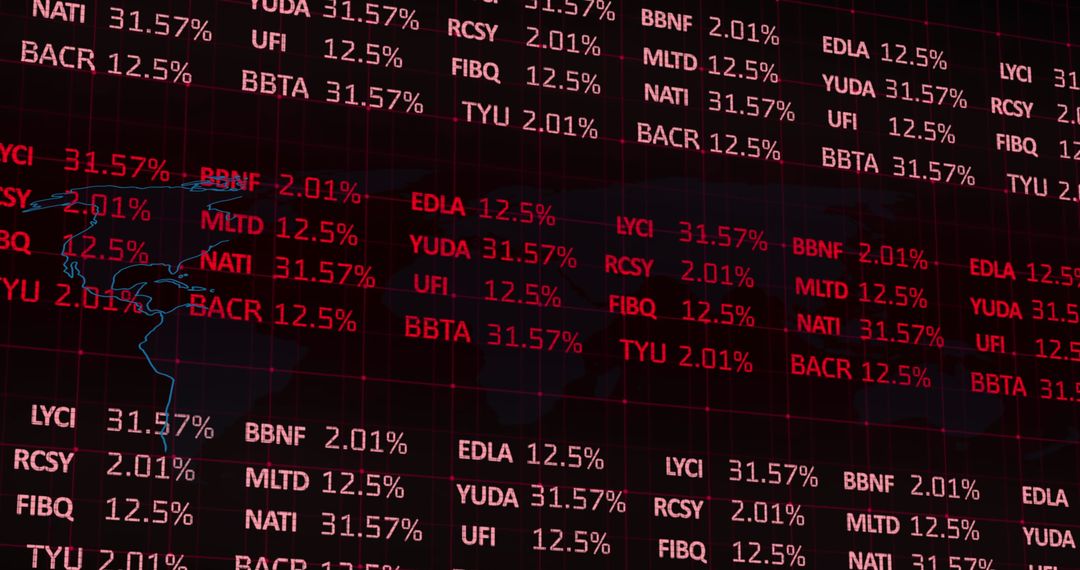
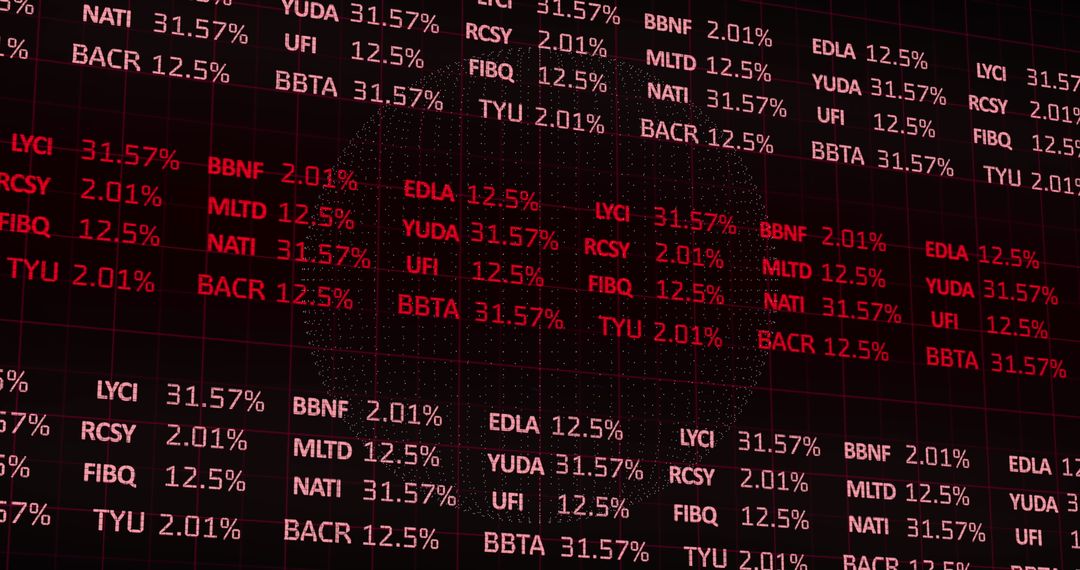
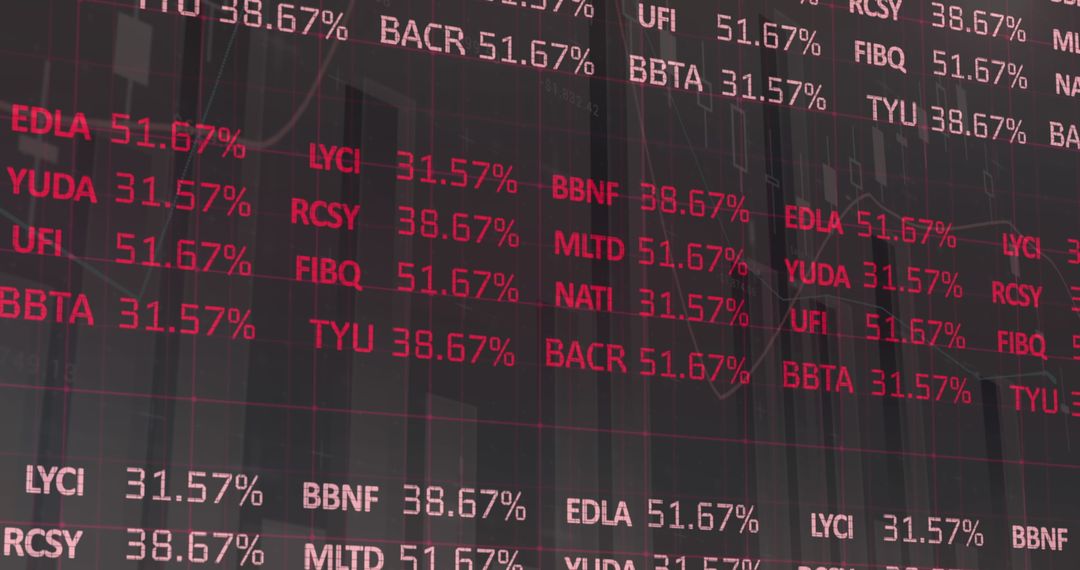
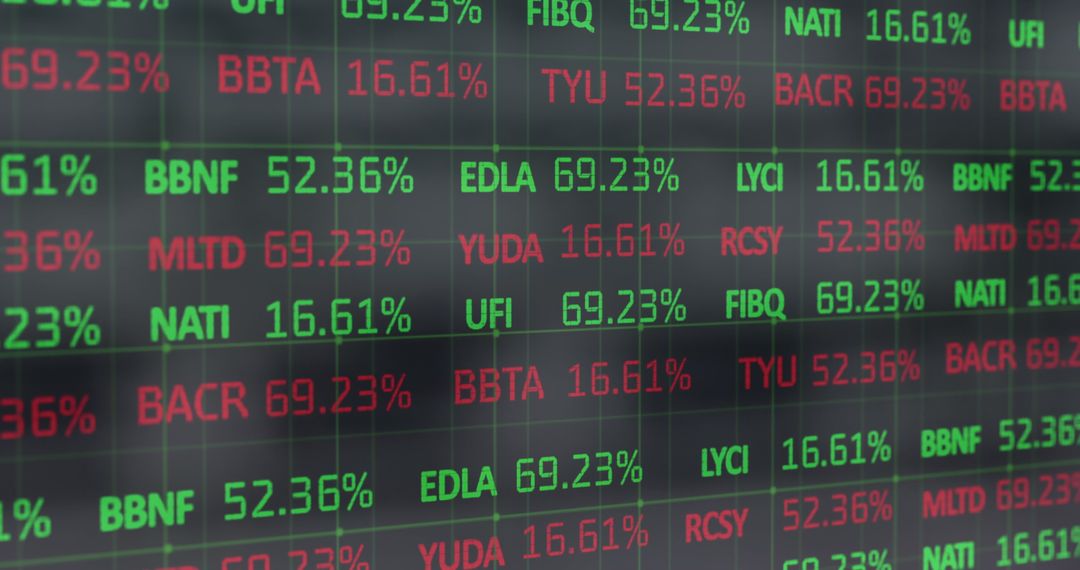
- Dynamic Financial Data Display with Red Statistics on Black Background
Dynamic Financial Data Display with Red Statistics on Black Background Image

Digitally generated display showcasing financial statistics with red text on a black background. This image evokes concepts of global finance and trading, effective for illustrating topics in finance, market analysis, or data processing in presentations and reports.
Powered by  - Get 15% off with code: PIKWIZARD15


2
downloads
downloads
Tags:
More
Credit Photo
If you would like to credit the Photo, here are some ways you can do so
Text Link
photo Link
<span class="text-link">
<span>
<a target="_blank" href=https://pikwizard.com/photo/dynamic-financial-data-display-with-red-statistics-on-black-background/eb02863cf9c6fc3048cd8843a29ab3f1/>PikWizard</a>
</span>
</span>
<span class="image-link">
<span
style="margin: 0 0 20px 0; display: inline-block; vertical-align: middle; width: 100%;"
>
<a
target="_blank"
href="https://pikwizard.com/photo/dynamic-financial-data-display-with-red-statistics-on-black-background/eb02863cf9c6fc3048cd8843a29ab3f1/"
style="text-decoration: none; font-size: 10px; margin: 0;"
>
<img src="https://pikwizard.com/pw/medium/eb02863cf9c6fc3048cd8843a29ab3f1.jpg" style="margin: 0; width: 100%;" alt="" />
<p style="font-size: 12px; margin: 0;">PikWizard</p>
</a>
</span>
</span>
Free (free of charge)
Free for personal and commercial use.
Author: Creative Art
Similar Free Stock Images

Premium


Premium


Premium


Premium


Premium


Premium


Premium


Premium


Premium


Premium


Premium


Premium


Premium


Premium


Premium


Premium


Premium


Premium


Premium


Premium


Premium


Premium


Premium


Premium

