- Home >
- Stock Photos >
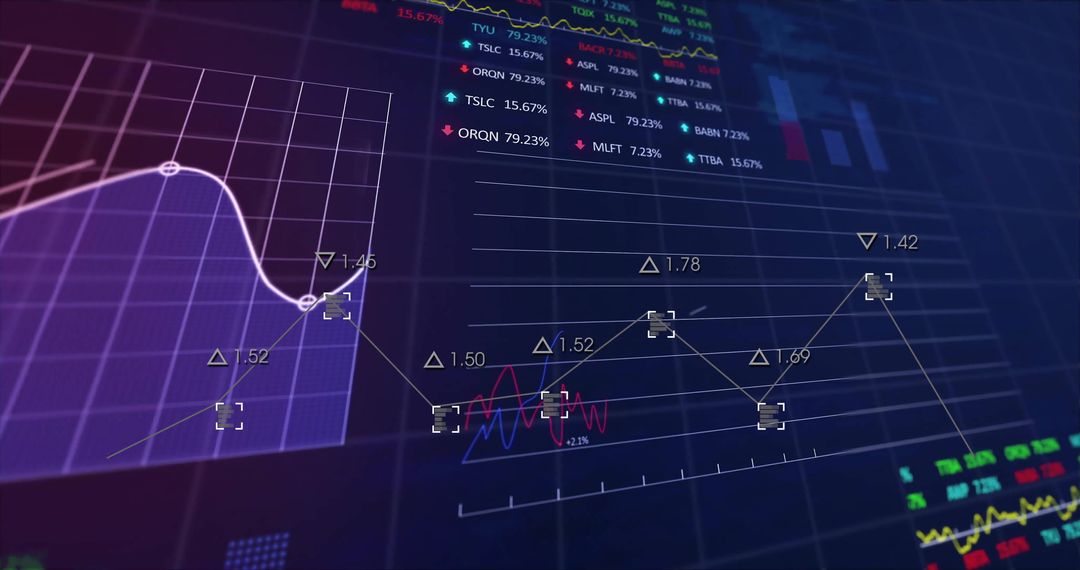
- Dynamic Financial Data Display with Stock Market Tickers
Dynamic Financial Data Display with Stock Market Tickers Image

Depicts real-time stock market data with colorful ticker displays and graphs. Ideal for illustrating finance and business-related articles or presentations that discuss economic growth, investment strategies, or market analysis. Useful for teaching materials emphasizing financial literacy and data interpretation.
Powered by  - Get 15% off with code: PIKWIZARD15


2
downloads
downloads
Tags:
More
Credit Photo
If you would like to credit the Photo, here are some ways you can do so
Text Link
photo Link
<span class="text-link">
<span>
<a target="_blank" href=https://pikwizard.com/photo/dynamic-financial-data-display-with-stock-market-tickers/1e23bc8cad749006c0f96048294c5650/>PikWizard</a>
</span>
</span>
<span class="image-link">
<span
style="margin: 0 0 20px 0; display: inline-block; vertical-align: middle; width: 100%;"
>
<a
target="_blank"
href="https://pikwizard.com/photo/dynamic-financial-data-display-with-stock-market-tickers/1e23bc8cad749006c0f96048294c5650/"
style="text-decoration: none; font-size: 10px; margin: 0;"
>
<img src="https://pikwizard.com/pw/medium/1e23bc8cad749006c0f96048294c5650.jpg" style="margin: 0; width: 100%;" alt="" />
<p style="font-size: 12px; margin: 0;">PikWizard</p>
</a>
</span>
</span>
Free (free of charge)
Free for personal and commercial use.
Author: Awesome Content
Similar Free Stock Images

Premium


Premium


Premium


Premium


Premium


Premium


Premium


Premium


Premium


Premium


Premium


Premium


Premium


Premium


Premium


Premium


Premium


Premium


Premium


Premium


Premium


Premium


Premium


Premium