
- Home >
- Stock Photos >
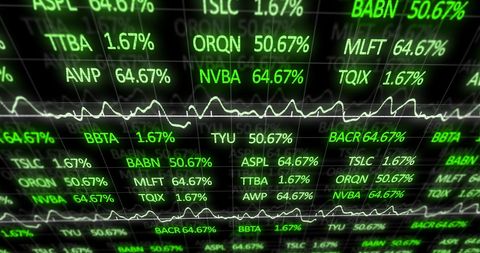
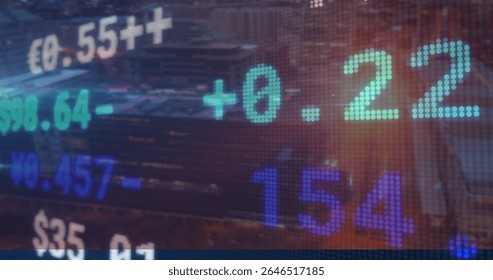
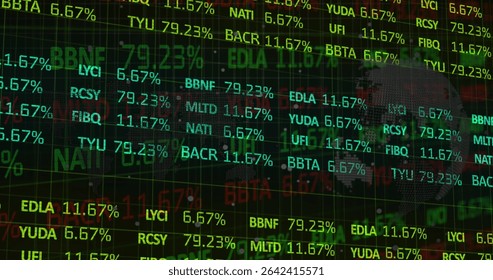
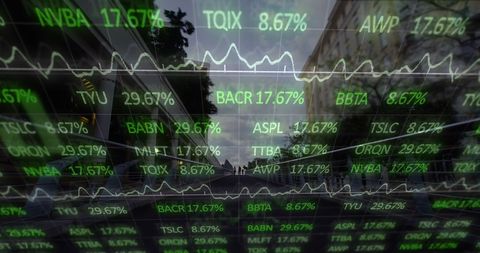
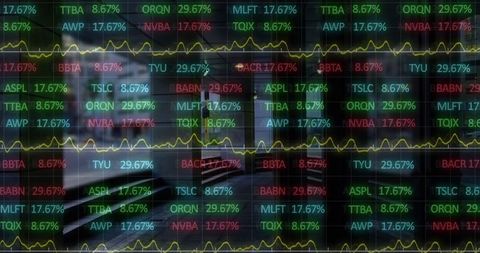
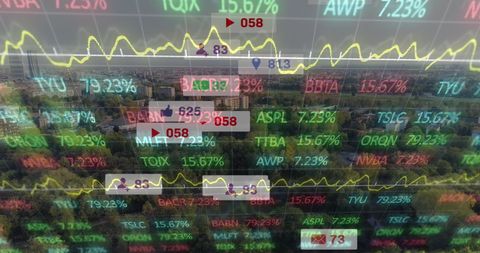
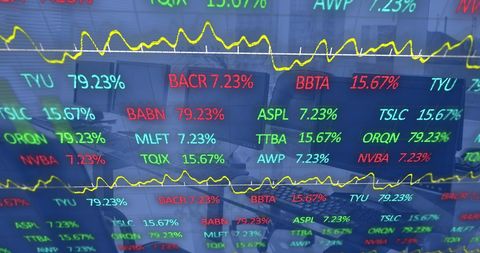
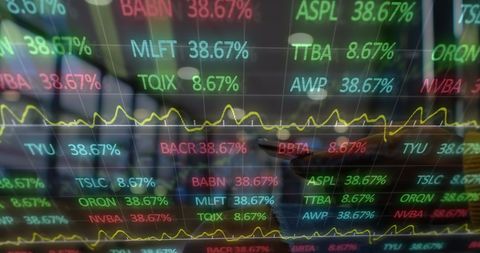
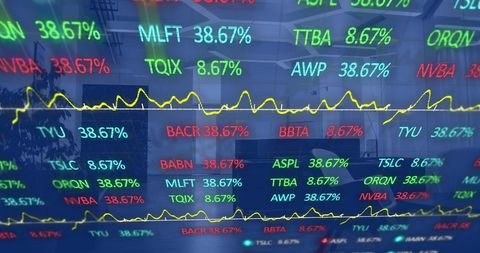
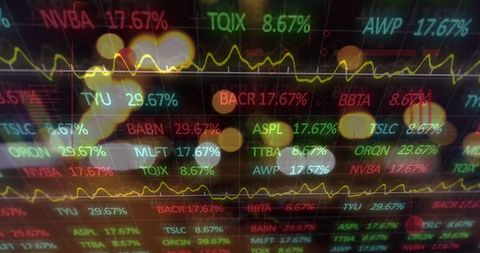
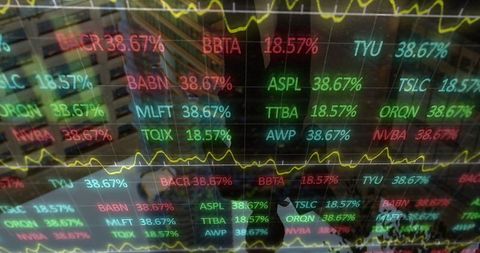
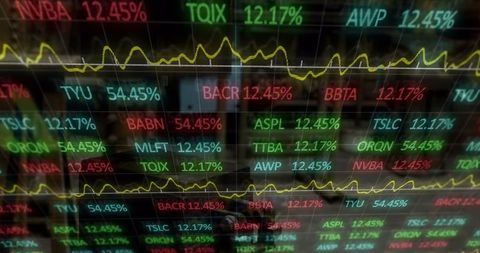
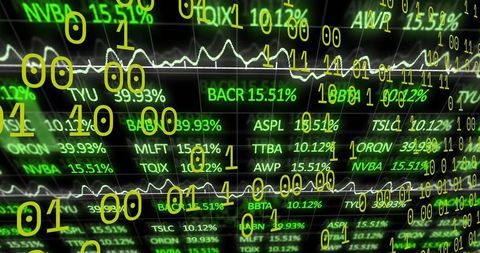
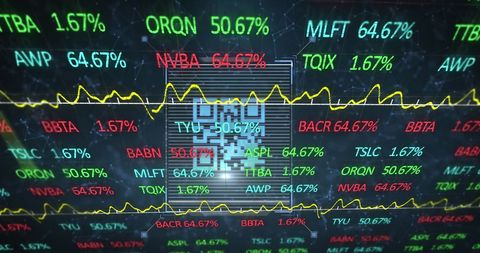
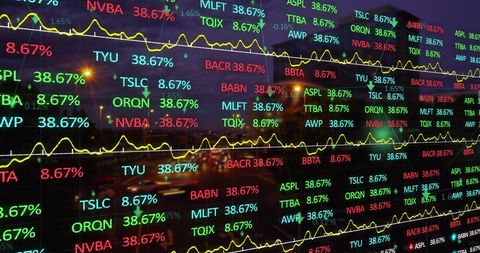
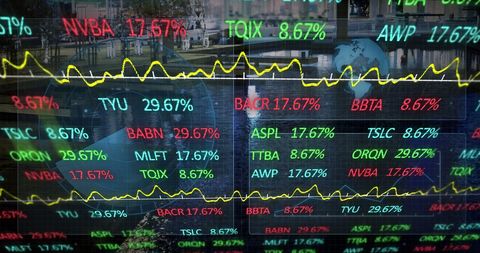
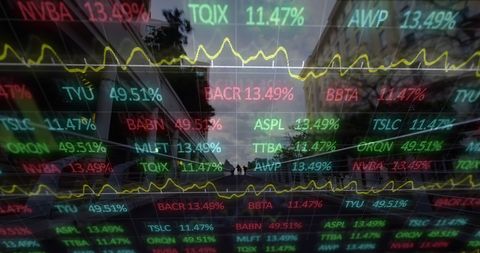
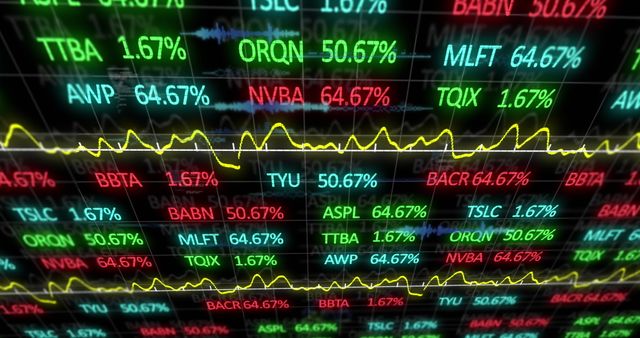
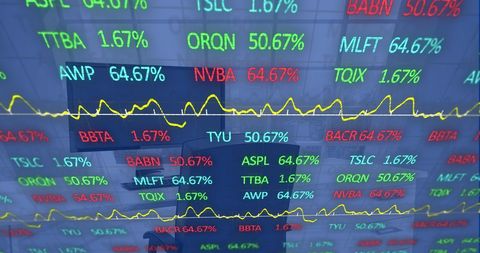
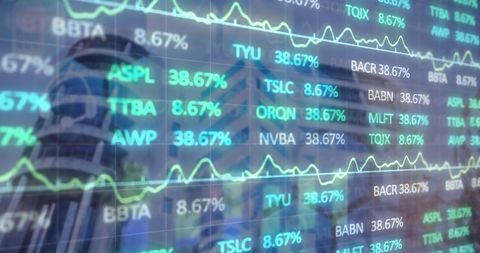
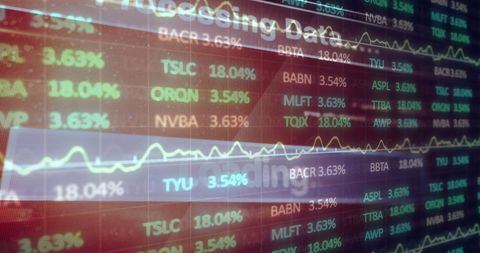
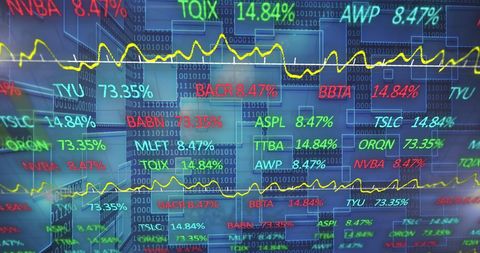
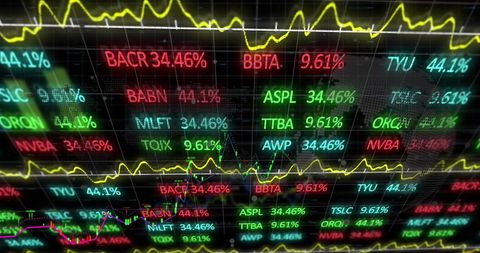
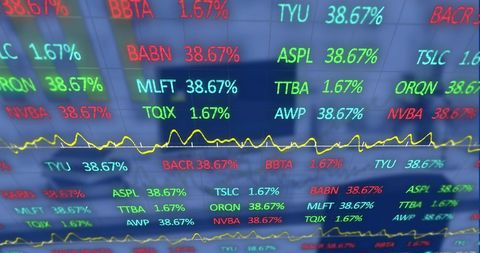
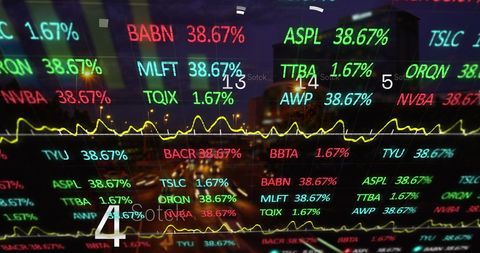
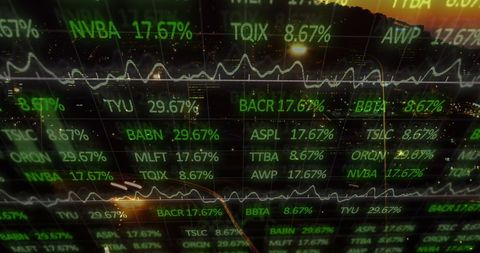
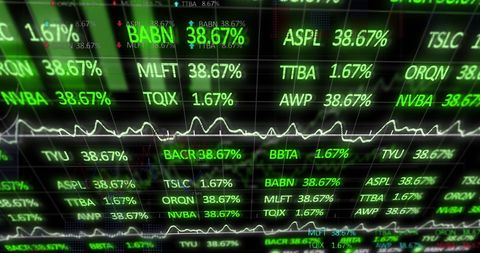
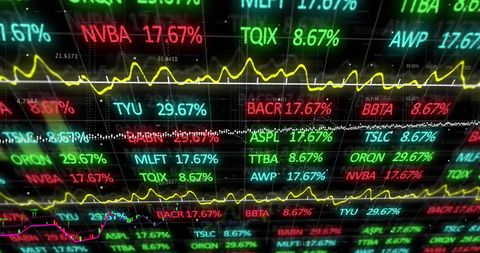
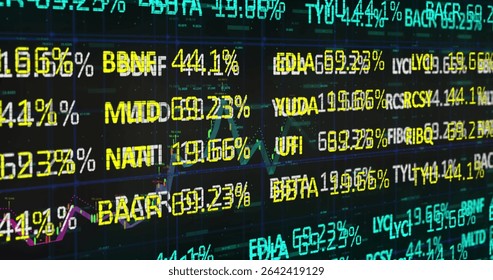
- Dynamic Financial Data Display with Stock Tickers and Graphs
Dynamic Financial Data Display with Stock Tickers and Graphs Image
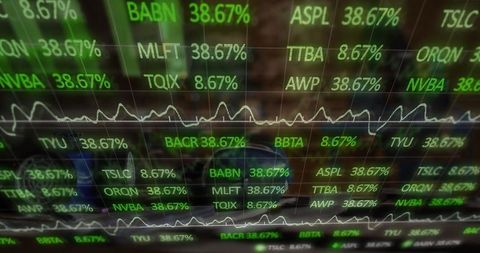
Finance enthusiast or professional uses monitoring equipment showing animated stock market tickers, percentages, line graphs. Compact visual enables efficient data interpretation, suited for business reports or media about finance, investments, or economic health. Use for presentations, financial blogs, or educational content explaining stock market functionality.
Powered by  - Get 15% off with code: PIKWIZARD15


downloads
Tags:
More
Credit Photo
If you would like to credit the Photo, here are some ways you can do so
Text Link
photo Link
<span class="text-link">
<span>
<a target="_blank" href=https://pikwizard.com/photo/dynamic-financial-data-display-with-stock-tickers-and-graphs/4cb283e1cfdca8acc85320f927428cd6/>PikWizard</a>
</span>
</span>
<span class="image-link">
<span
style="margin: 0 0 20px 0; display: inline-block; vertical-align: middle; width: 100%;"
>
<a
target="_blank"
href="https://pikwizard.com/photo/dynamic-financial-data-display-with-stock-tickers-and-graphs/4cb283e1cfdca8acc85320f927428cd6/"
style="text-decoration: none; font-size: 10px; margin: 0;"
>
<img src="https://pikwizard.com/pw/medium/4cb283e1cfdca8acc85320f927428cd6.jpg" style="margin: 0; width: 100%;" alt="" />
<p style="font-size: 12px; margin: 0;">PikWizard</p>
</a>
</span>
</span>
Free (free of charge)
Free for personal and commercial use.
Author: Creative Art
Similar Free Stock Images
Loading...
Premium


Premium

Premium


Premium


Premium

Premium


Premium

Premium


Premium

Premium


Premium
Premium

Premium

Premium


Premium

Premium


Premium


Premium

Premium


Premium


Premium


Premium


Premium


Premium


Premium

