
- Home >
- Stock Photos >
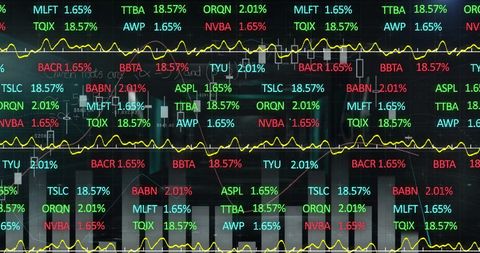
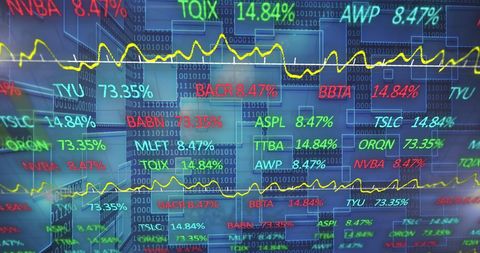
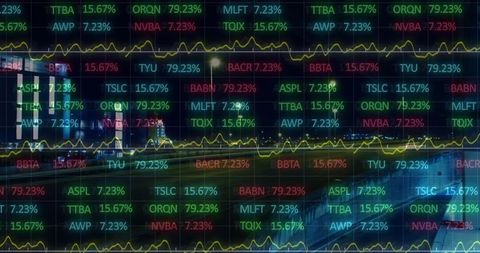
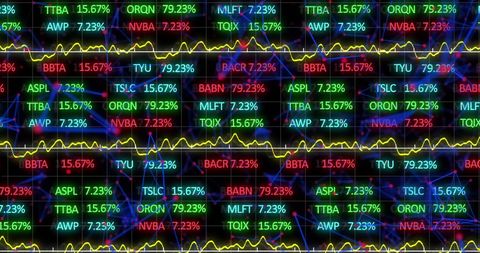
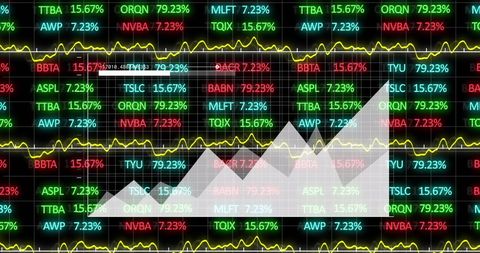
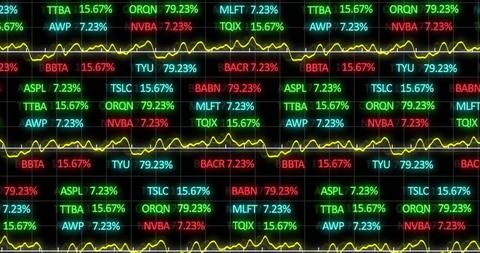
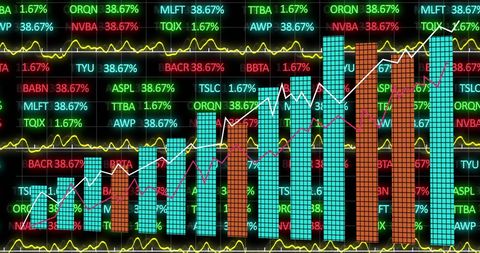
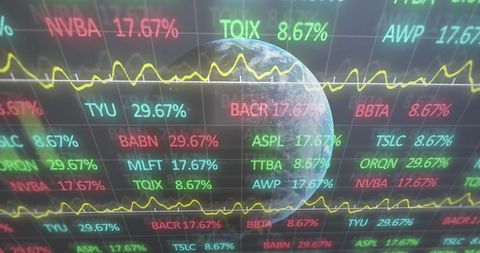
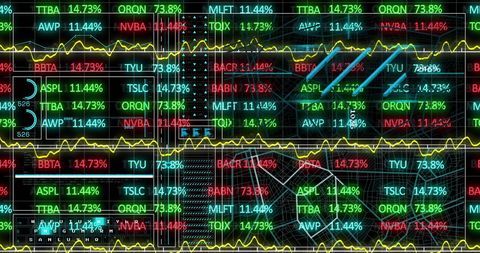
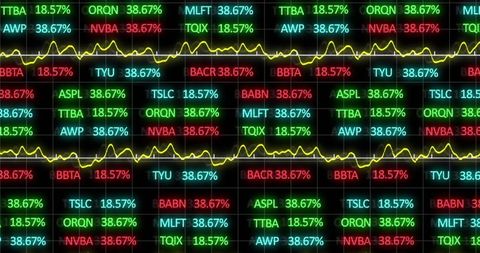
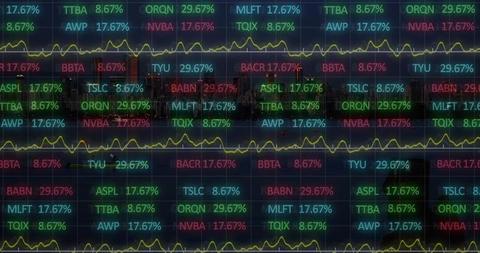
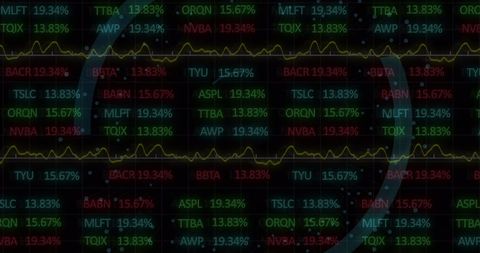
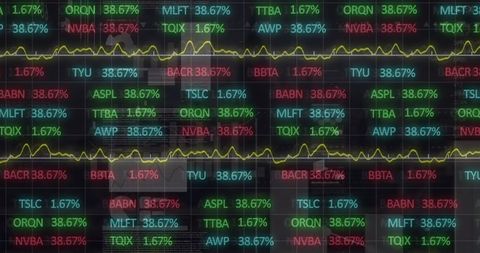
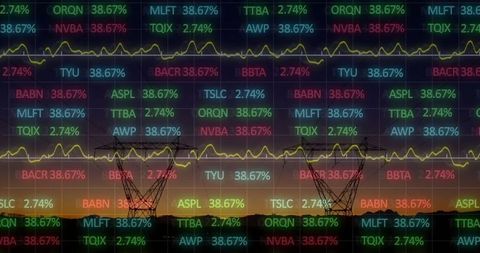
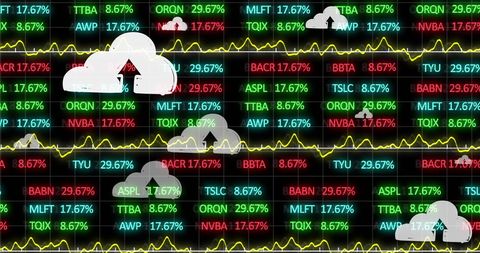
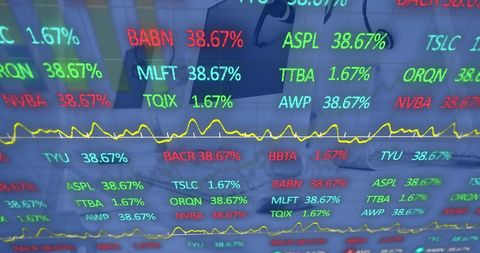
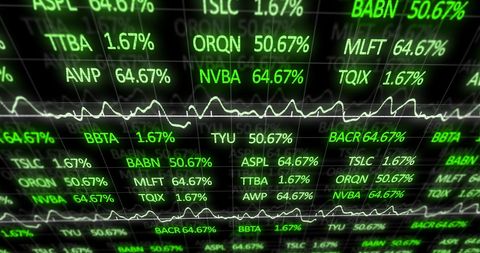
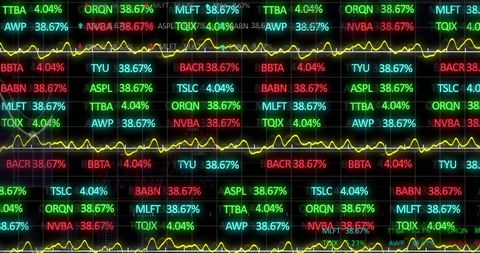
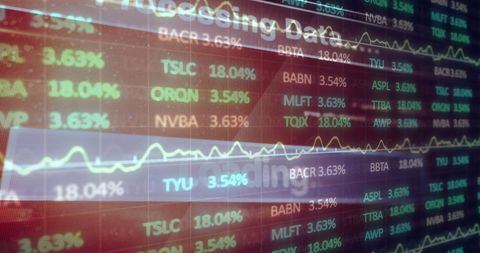
- Dynamic Financial Data Flow and Market Analysis in Motion
Dynamic Financial Data Flow and Market Analysis in Motion Image
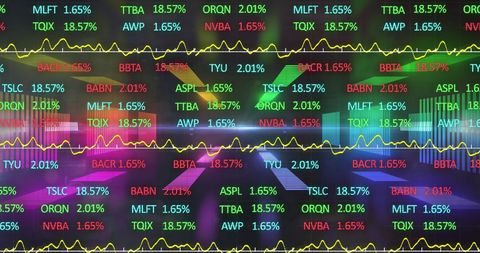
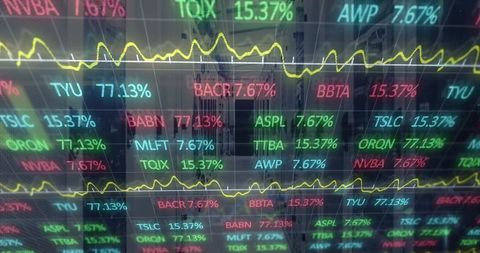
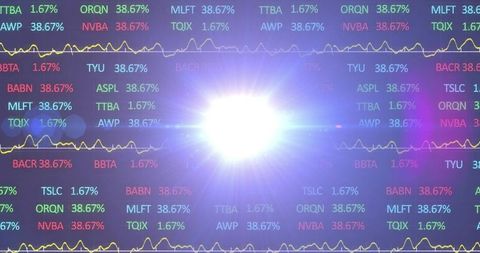
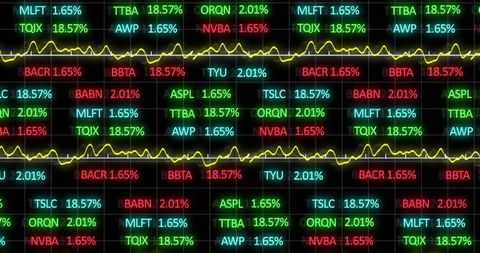
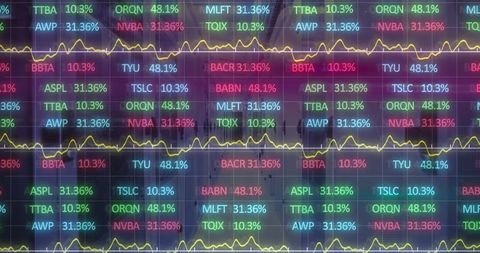
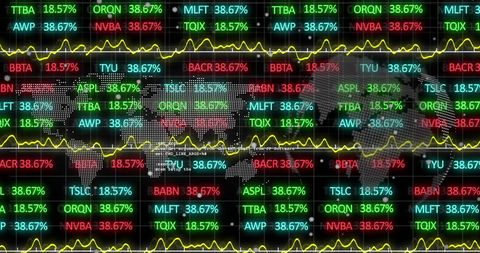
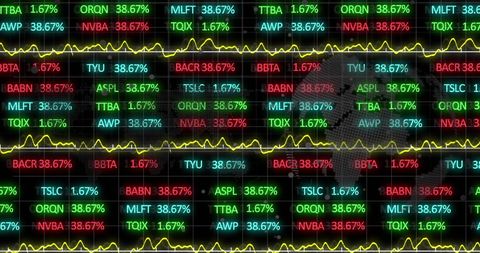
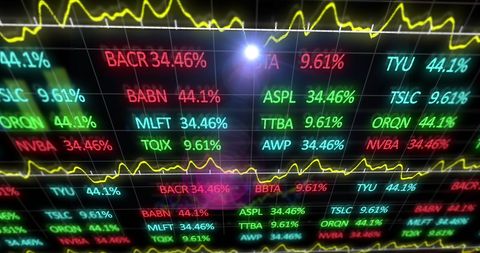
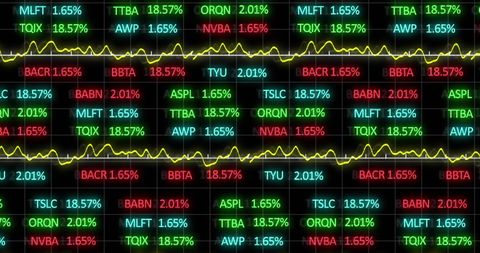
Illustrates vibrant, moving interconnected digital diagrams displaying stock values and increases in percentage. Ideal for financial analytics, stock trading, technology companies, market strategy representation, or editorial promotion of finance research platforms.
Powered by  - Get 15% off with code: PIKWIZARD15


downloads
Tags:
More
Credit Photo
If you would like to credit the Photo, here are some ways you can do so
Text Link
photo Link
<span class="text-link">
<span>
<a target="_blank" href=https://pikwizard.com/photo/dynamic-financial-data-flow-and-market-analysis-in-motion/d64b6898fcdeaa7ddab65d86bf522f3b/>PikWizard</a>
</span>
</span>
<span class="image-link">
<span
style="margin: 0 0 20px 0; display: inline-block; vertical-align: middle; width: 100%;"
>
<a
target="_blank"
href="https://pikwizard.com/photo/dynamic-financial-data-flow-and-market-analysis-in-motion/d64b6898fcdeaa7ddab65d86bf522f3b/"
style="text-decoration: none; font-size: 10px; margin: 0;"
>
<img src="https://pikwizard.com/pw/medium/d64b6898fcdeaa7ddab65d86bf522f3b.jpg" style="margin: 0; width: 100%;" alt="" />
<p style="font-size: 12px; margin: 0;">PikWizard</p>
</a>
</span>
</span>
Free (free of charge)
Free for personal and commercial use.
Author: Awesome Content
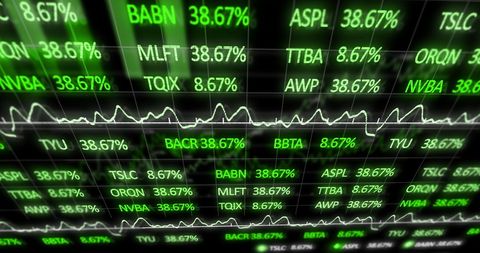
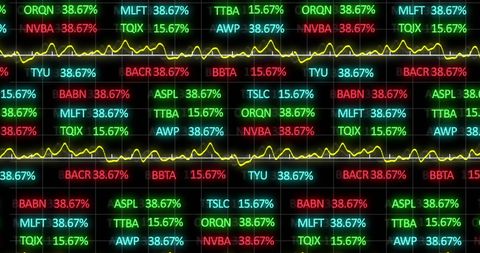
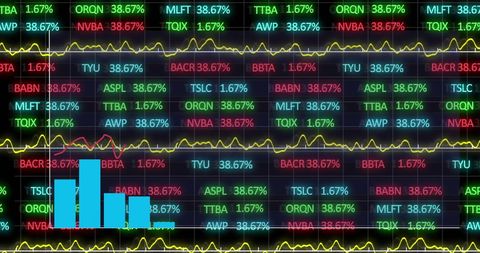
Similar Free Stock Images

Premium

Premium


Premium


Premium


Premium

Premium


Premium

Premium

Premium


Premium


Premium


Premium


Premium


Premium


Premium


Premium


Premium


Premium

Premium


Premium


Premium


Premium


Premium

Premium


Premium


Explore More Free Stock Images