1. Home > 
  2. Stock Photos > 
  3. Dynamic Financial Data Graph Visualization on Black Background

Dynamic Financial Data Graph Visualization on Black Background Image

Dynamic Financial Data Graph Visualization on Black Background

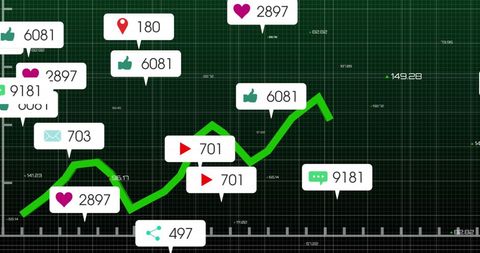
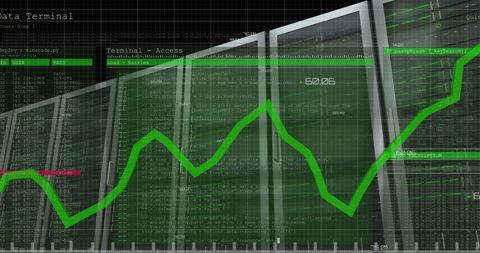
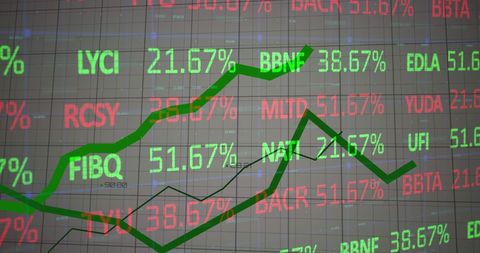
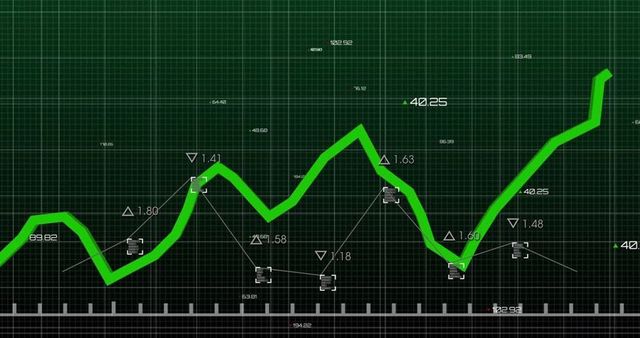
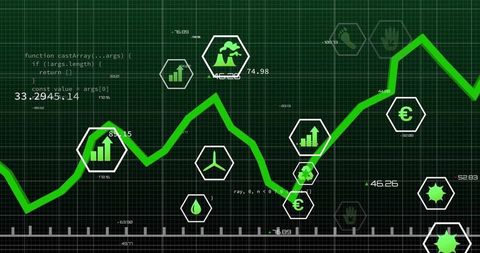
Visual displays a dynamic representation of financial data on a black background, showcasing a green graph line with numerical figures. Ideal for use in presentations and marketing materials related to stock market analysis, business strategy, technology, and data-driven decision making.

Powered by Shutterstock logo - Get 15% off with code: PIKWIZARD15
Man look at the dashboard with graphs and charts. Concept of data management system, business intelligence, data statistics, marketing analysis, key performance indicators (KPI) and analytics. - Powered by Shutterstock - Get 15% off with code: PIKWIZARD15Man look at the dashboard with graphs and charts. Concept of data management system, business intelligence, data statistics, marketing analysis, key performance indicators (KPI) and analytics. - Powered by Shutterstock - Get 15% off with code: PIKWIZARD15Using tablet pc, Consultant between bookkeepers and accounting lawyer consultation about asset, balance sheet, stock market statistics and yearly tax law, protect business from bribery. - Powered by Shutterstock - Get 15% off with code: PIKWIZARD153D blue bar graph rising, sotck market informations - Powered by Shutterstock - Get 15% off with code: PIKWIZARD15Man Typing Keyboard Laptop Hand.Project Manager Researching Process.Business Team Working Startup modern Office.Global Strategy Virtual Icon.Innovation Graphs Interfaces.Analyze market stock.Blurred - Powered by Shutterstock - Get 15% off with code: PIKWIZARD15

Credit Photo

If you would like to credit the Photo, here are some ways you can do so

Free (free of charge)

Free for personal and commercial use.

Author: Authentic Images

Similar Free Stock Images

Rising Green Line on Financial Digital Display
Premium
Rising glow arrows on white stairway as business chart steps on grid, blue background. Business economic and marketing growth graph process, higher goal, success, profit, financial investment concept.
Dynamic Stock Market Data Over Urban Abstract Background
Futuristic Financial Graphs with Dynamic Green Line
Digital Business and Technology Abstract with Declining Growth
Statistical Data Processing with Cityscape Overlay
Premium
Using tablet pc, Consultant between bookkeepers and accounting lawyer consultation about asset, balance sheet, stock market statistics and yearly tax law, protect business from bribery.
Dynamic Financial Graph Analyzing Market Trends
Dynamic Line Graph on Business Office Background Depicting Growth
Data Trends Visualization Over Virus Background
Financial Data Visualization with Green Graph Line on Blue Background
Premium
Man Use Smartphone Hand,touch screen.Project Manager Researching Process.Business Team Work Startup modern Office.Global Strategy Virtual Icon.Innovation Graphs Interface.Analyze market stock.Blurred
Dynamic Green Line Graph on Data Grid Background
Rising Data Graph with Changing Numbers on Blue Grid
Rising Chart Line Over Digital Grid Representing Financial Growth
Holographic Financial Graphs and Data Representation
Premium
Woman Touching Screen Electronic Tablet Hand.Project Managers Researching Process.Business Team Working New Startup modern Office.International Digital Charts Interfaces.Analyze market stock.Blurred
Declining Financial Chart Displayed Over Urban Cityscape
Stock Market Graph with Fluctuations and Financial Data
Dynamic Financial Statistics with Cityscape Overlay
Financial Chart Overlay on Modern Office Background
Premium
Data monetization concept with funnel and businessman
Dynamic Financial Graph with Bar Chart on Digital Grid
Dynamic Data Visualization with Green Graph Lines on White Background
Dynamic Growth Over Time on Grid Background
Green Line Graph Overlaid on Empty Office with Data Overlay
Premium
AI(Artificial Intelligence) and Financial Technology concept.Robot Hand Stacking pile of Coins,Financial technology, Stock chart,Investment,Fintech on white background.
Digital Green Graph Lines on Grid Showing Business Analytics
Businesswoman with Suitcase Walking Viewed Through Financial Analytics
Dynamic Financial Chart with Currency Symbols and Digital Network
Data Visualization Dashboard with Eco-Friendly Themes and Progress Indicators
Dynamic Data Trends on Digital Display for Financial Analysis
Digital Interface Concept with Data Processing on Servers
Premium
Analytics Report Status Information Analysis Chart Graph Concept
Circuitry and Data Stream on Digital Grid Background
Green Line Graph Over Digital Grid Highlighting Data Trends
Graph Overlay on Business Meeting, Data Analysis Concept
Abstract Financial Graphs Displaying Market Trends
Premium
Abstract virtual financial graph hologram on USA flag and sunset sky background, forex and investment concept. Multiexposure
Red Financial Trendline in Digital Interface Background
Dynamic Graph Analysis over Covid-19 Virus Cells
Financial Market Chart on Digital Screen Showing Growing Trends
Financial Analytics Chart in Digital Interface Design
Premium
Artificial intelligence Digital file management, Investment financial global economy concept. Businessman using laptop analysing virtual global and trading graph, stock market trade, online business.
Red Data Line Declining Across Digital Security Screen
Dynamic Statistical Graphs on Gradient Background
Financial Data Graph with Rising Green Line and Analytics Dashboard
Financial Data Visualization with Red Downtrend Line in Virtual Environment
Premium
Image of financial data processing over stadium. Global sport, finances and digital interface concept digitally generated image.
Abstract Digital Art of Purple Shapes on Textured Blue Background
Data Center with Rising Trends on Digital Graph
Rising Data Graph Over Digital Servers in Futuristic Environment
Financial Data Visualization with Dynamic Graphical Analysis
Premium
Financial graphs and data processing image over city skyline background. Finance, economy, analytics, technology, urban, stock market
Digital Stock Market Data on Red Background
Stock Market Decline Data Analysis on Dark Grid Background
Abstract Data Visualization with Graphs over Digital Grid Background
Dynamic Financial Market Graph with Data Points
Premium
Multi exposure of woman on-line shopping holding a credit card and financial graph drawing. Stock market E-commerce concept.
Digital Stock Market Data Visualization with Binary Interface
Stylized Dashboard Displaying Colored Data Analytics Line Graphs
Beveled Green Trend Line Moving Across Dark Blue Grid Showing Market Data Visualization
Dynamic Graphs Depicting Financial Trends on Purple Grid Background
Financial Market Decline Illustrated on Grid Chart
Abstract Data Processing Flow on Digital Interface
Premium
business people analyze virtual graphic financial graph chart diagram on mobile laptop computer, digital technology, business strategy, stock market investment, business finance technology concept
Dynamic Data Trends Over Digital Graph with Pink Background
Diverse Businesswomen Analyzing Financial Growth with Digital Graph Overlay
Cryptocurrency Growth Chart Over Digital World Map
Financial Data Growth Over Urban Cityscape with Graph Overlay
Premium
Beautiful 3D red bar graph fall down following the arrow.
Digital Lock with Real-Time Data Display
Abstract Digital Graph with Data Visuals and Scope Interface
Digital Display of Financial Decline Graph and Data Connectivity
Social Media Notifications and Growth Chart Dynamics
Premium
Stock market data on LED display concept. A large display of daily stock price and quotation.
Dynamic Red Line Graph on Digital Black Grid Background
Dynamic Financial Graph with Growth Patterns on Digital Screen
Declining Stock Market Trends with Digital World Map
Futuristic Financial Trading Graph and Data Visualization
Premium
AI(Artificial Intelligence) and Financial Technology concept.Robot Hand Stacking pile of Coins,Financial technology,Stock chart,Investment,Fintech on white background.
Green Financial Data Chart with Technological Overlay
Digital Data Processing Analysis Over Computer Servers
Digital Interface with Overlapping Code and Graph
Dynamic Financial Data Chart with Red Trend Line on Green Background
Premium
strategy analysis concept, Businessman working  financial Manager Researching Process accounting calculate analyse market graph data stock information review on the table in office.
Digital Decline Graphic with QR Code Elements and Red Line
Data Visualization Social Media Interaction Concept
Digital Stock Market Data with Upward Trend Graph
Green Line Graph Rising on Gradient Background Shows Financial Growth
Premium
Woman Touching Display Digital Tablet Hand.Project Manager Researching Process.Business Team Working Startup modern Coworking.Analyze market stock.Using electronic device,paper,note wood table.Blurred
Rising Trend in Financial Analysis Overlaid on Laptop Silhouette
Global Market Trends Featuring Multi-Series Line Charts Over Dotted World Map and Grid
Dynamic Chart and Globe Depict Global Financial Movement
Digital Data Processing with Grid Interface
Digital Security Illustration with Graph and Binary Codes
Global Data Trends Analysis with Networking Interfaces
Premium
Analytical data and development statistics. Web analytics and product testing techniques are being measured. A guy studies an SEO dashboard and a digital report.
Dynamic Financial Data Visualization Chart with Trending Lines
Digital Data Visualization with Dynamic Graph and Global Interface
Dynamic Financial Data Graph with Colorful Waves
Digital Fingerprint with Rising Statistic Line and Data Interface
Premium
Using tablet pc, Consultant between bookkeepers and accounting lawyer consultation about asset, balance sheet, stock market statistics and yearly tax law, protect business from bribery.
Global Financial Data Trends on World Map
Green Line Graph on Grid Interface Displaying Financial Data Trends
Dynamic Financial Growth Graph on Blue Grid Background
Declining Financial Graph Over Data Grid with Global Background
Premium
Man Typing Laptop,use Smartphone Hand.Project Manager Researching Process.Business Team Work Startup modern Office.Global Strategy Virtual Icon.Innovation Graphs Interface.Analyze market stock.Blurred
Male Doctor Analyzing Growth Data with Digital Graph Overlay
Dynamic Global Data Insights with Trend Lines
Dynamic Stock Market with Percentage Fluctuations
Financial Growth Concept with Green Upward Line Graph
Premium
Digital tablet showing charts
Colorful Financial Graphs on Digital Grid Background
Financial Data Visualization with Grid and Graph Lines
Abstract Financial Data Visualization on Purple Grid
Red up and down financial graph on grey digital background
Premium
Stock market data on LED display concept.a large display of daily stock price and quotation.
Global Financial Data and Social Media Escalation Chart
Dynamic Green Business Data Graph with Office Backdrop
Green Analytics Line Graph on Dark Grid Background
Digital Dashboard Analytics Graphic Illustrating Trends
Premium
Woman Touching Screen Electronic Tablet Hand.Project Managers Researching Process.Business Team Working New Startup modern Office.Digital Connections world wide interfaces.Analyze market stock.Blurred
Glowing neon line graph streaming across futuristic data visualization dashboard