
- Home >
- Stock Photos >
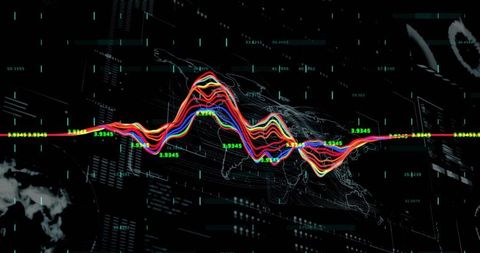
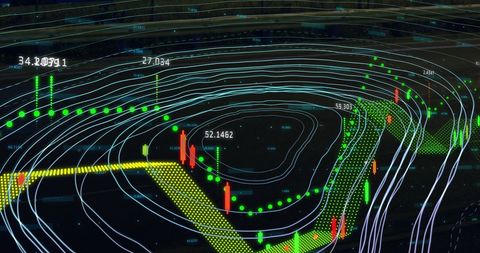
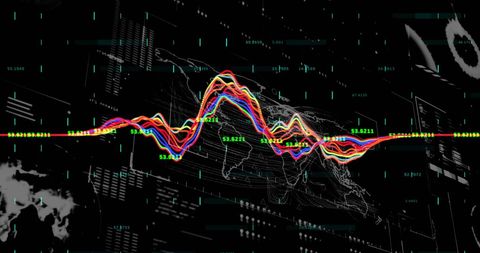
- Dynamic Financial Data Graph with Colorful Waves
Dynamic Financial Data Graph with Colorful Waves Image

Digitally generated visual of financial data processing presents chart with colorful lines and bar graphs. Useful for representing stock market trends, economic analysis, or trading technologies. Ideal for use in presentations, websites focused on finance, and educational materials regarding data interpretation.
Powered by 


downloads
Tags:
More
Credit Photo
If you would like to credit the Photo, here are some ways you can do so
Text Link
photo Link
<span class="text-link">
<span>
<a target="_blank" href=https://pikwizard.com/photo/dynamic-financial-data-graph-with-colorful-waves/654fdd22a9bb23cd24cb4328fdb4305e/>PikWizard</a>
</span>
</span>
<span class="image-link">
<span
style="margin: 0 0 20px 0; display: inline-block; vertical-align: middle; width: 100%;"
>
<a
target="_blank"
href="https://pikwizard.com/photo/dynamic-financial-data-graph-with-colorful-waves/654fdd22a9bb23cd24cb4328fdb4305e/"
style="text-decoration: none; font-size: 10px; margin: 0;"
>
<img src="https://pikwizard.com/pw/medium/654fdd22a9bb23cd24cb4328fdb4305e.jpg" style="margin: 0; width: 100%;" alt="" />
<p style="font-size: 12px; margin: 0;">PikWizard</p>
</a>
</span>
</span>
Free (free of charge)
Free for personal and commercial use.
Author: Creative Art
Similar Free Stock Images

Premium


Premium

Premium


Premium


Premium


Premium


Premium


Premium


Premium


Premium

Premium

Premium


Premium

Premium


Premium


Premium


Premium


Premium

Premium


Premium


Premium


Premium


Premium


Premium

Premium


Explore More Free Stock Images