- Home >
- Stock Photos >
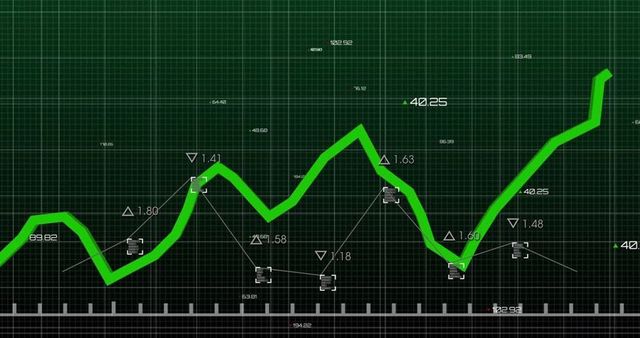
- Dynamic Financial Data Graph with Global Grid Background
Dynamic Financial Data Graph with Global Grid Background Image

Colorful financial graph lines on a digital grid map with global overlays. Useful for illustrating concepts related to finance, stock markets, business analysis, and international economics. Ideal for business presentations, financial reports, and editorial usage around global business metrics.

downloads
Tags:
More
Credit Photo
If you would like to credit the Photo, here are some ways you can do so
Text Link
photo Link
<span class="text-link">
<span>
<a target="_blank" href=https://pikwizard.com/photo/dynamic-financial-data-graph-with-global-grid-background/21e92ba10b1b5e85f8ce7832e3fb7e0d/>PikWizard</a>
</span>
</span>
<span class="image-link">
<span
style="margin: 0 0 20px 0; display: inline-block; vertical-align: middle; width: 100%;"
>
<a
target="_blank"
href="https://pikwizard.com/photo/dynamic-financial-data-graph-with-global-grid-background/21e92ba10b1b5e85f8ce7832e3fb7e0d/"
style="text-decoration: none; font-size: 10px; margin: 0;"
>
<img src="https://pikwizard.com/pw/medium/21e92ba10b1b5e85f8ce7832e3fb7e0d.jpg" style="margin: 0; width: 100%;" alt="" />
<p style="font-size: 12px; margin: 0;">PikWizard</p>
</a>
</span>
</span>
Free (free of charge)
Free for personal and commercial use.
Author: Authentic Images