1. Home > 
  2. Stock Photos > 
  3. Dynamic Financial Data Graphs and Charts Overlay in Blue Tones

Dynamic Financial Data Graphs and Charts Overlay in Blue Tones Image

Dynamic Financial Data Graphs and Charts Overlay in Blue Tones

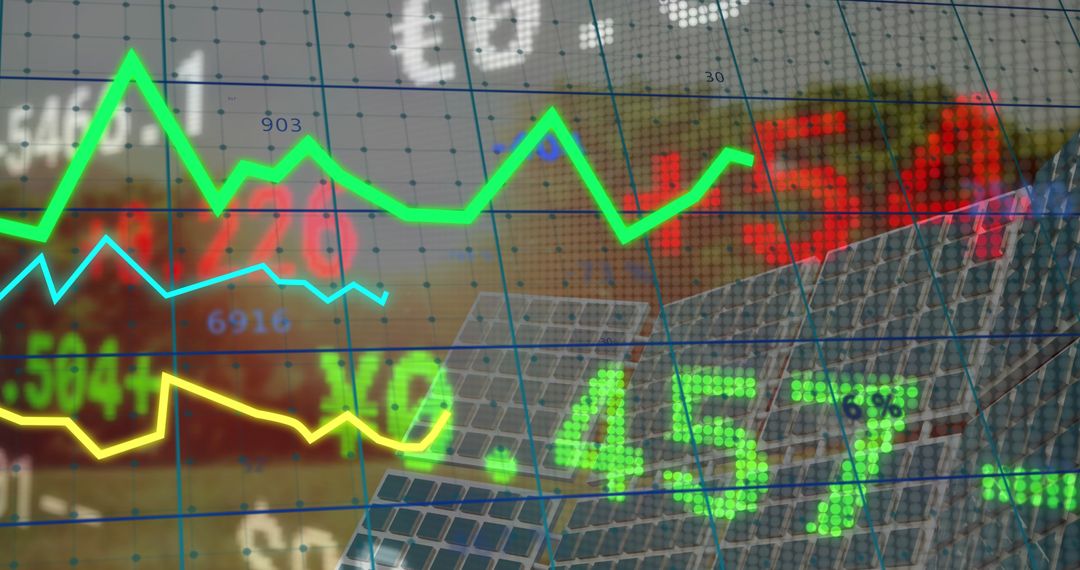
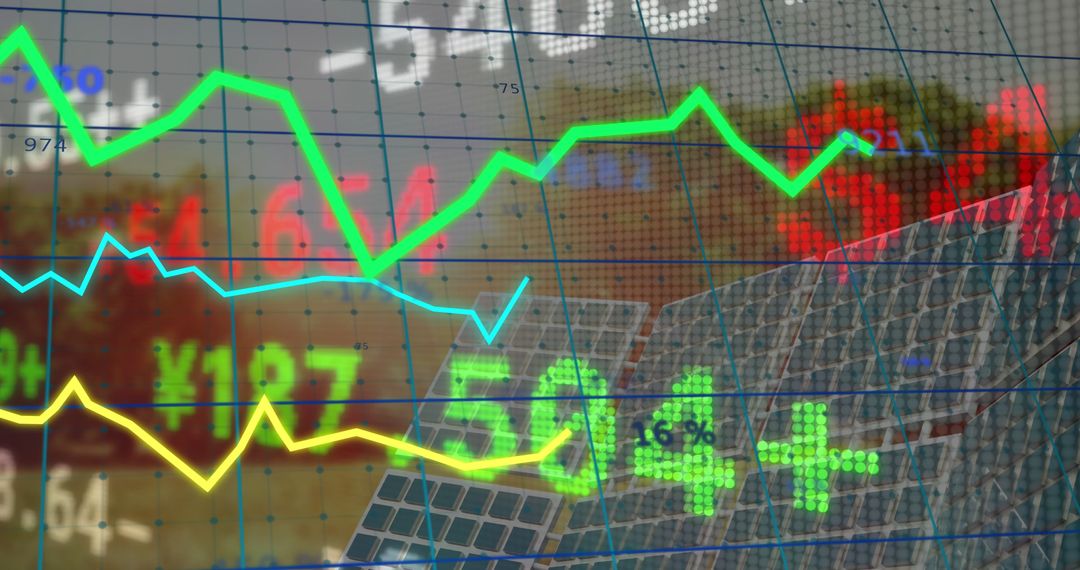
Interlaced line graphs and numeric data points against a blurred background showcasing a modern business concept. Ideal for use in financial reports, dashboards, presentations about market trends, business analytics, or investment publications focusing on technological advancements in finance.

Powered by Shutterstock logo - Get 15% off with code: PIKWIZARD15
Internet cyberspace data information collection analytical statistics computer storage ai artificial intelligence calculation, blue background banner copyspace. - Powered by Shutterstock - Get 15% off with code: PIKWIZARD15Businessman working on laptop, using mobile phone at modern office, analyzing business document with financial graph, market report on digital tablet, business data analysis concept - Powered by Shutterstock - Get 15% off with code: PIKWIZARD15Hand using a pen to interact with digital financial charts and algorithmic lines on a dark background. Concept of fintech and automated trading interface - Powered by Shutterstock - Get 15% off with code: PIKWIZARD15abstract Financial chart with moving up growing stock market graph in blue light color background - Powered by Shutterstock - Get 15% off with code: PIKWIZARD15Financial chart with moving up stock market graph in neon light color background - Powered by Shutterstock - Get 15% off with code: PIKWIZARD15

Credit Photo

If you would like to credit the Photo, here are some ways you can do so

Free (free of charge)

Free for personal and commercial use.

Author: Authentic Images

Similar Free Stock Images

Financial Data Graphs Over Cityscape Indicating Global Business Concept
Premium
3D blue bar graph rising, sotck market informations
Dynamic Financial Data Graph Overlaying Urban Skyline
Abstract Financial Graphs Overlapping Urban Skyline
Data Processing Overlay on Solar Panels Reflects Green Tech Insights
Financial Technology Overlaying Bustling Cityscape at Night
Premium
Display of Stock market quotes with city lights reflect on glass, small focus line
Futuristic Financial Data Visualization Powering Investment Decisions
Dynamic Financial Data Charts on Dark Digital Background
Security Hologram Over Digital Stock Market Analysis
Red Financial Trendline in Digital Interface Background
Premium
Stock trading graphic design for financial investment trade, Forex graph business or Stock graph line chart market exchange ,Technical price line with indicator on chart computer screen background
Global Financial Data Overlaid on Cityscape Background
Dynamic Financial Graphs on Digital Screen Displaying Market Trends
Stock Market Trends Visualized Against Urban Construction
Dynamic Stock Market Data and Cityscape Background
Premium
Financial chart with moving up arrow graph in stock market on blue color blurred background
Financial Data and Stock Market Trends Overlaying Cityscape
Futuristic Graphs Process Financial Data Over City Skyline
Financial Analytics Across Belarus Economic Landscape
Dynamic Financial Data with Global Connections and Insights
Premium
Finance data concept
Complex Financial Data Visuals with Coding Elements and Charts
Digital Finance Dashboard with Market Trend Analytics in Office
Doctor Analyzing Healthcare Data with Analytics Graphs
Financial Charts with Blue and Red Lines and Digital Percent Indicators
Premium
Displaying line chart fluctuating on market terminal, with green bars, percentages and grid overlay. Analytics, data visualization, finance, technology, digital interface, investment, performance
Digital Dashboard with Data Analytics and Visualization
Neon Financial Dashboard Displaying Market Trend Lines, Monthly Bar Analytics, Data Overlay
Futuristic finance dashboard overlaying datacenter racks with neon charts and metrics
Business Team Analyzing Financial Dashboard with Colorful Line, Bar and Pie Charts
Dynamic Financial Data Overlaying Urban Cityscape
Financial Data Visualization in Blue with Dynamic Graphics
Premium
Experienced businessman looking at financial data with graphics and charts while work on a laptop computer, young entrepreneur analyzing performance on his notebook, male freelancer work in interior
Dynamic Financial Data Display Over Global Stock Market
Data Analysis Digital Overlay on Solar Energy Concept
Global Business Data and Digital Interface Concept
Rising Graph with Data and Analysis Objects on Blue Background
Premium
Office Conference Room Meeting Presentation: Latin Businessman Talks, Uses Wall TV to Show Company Growth with Big Data Analysis, Graphs, Charts, Infographics. Multi-Ethnic e-Commerce Startup Workers
Global Financial Data Overlaid on Cloudy Sky Emphasizing Energy Sector
Stock Market Data Analysis with Digital Security Element
Dynamic Financial Data Visualization on Grid
Financial Graphs and Cityscape Merging Conceptualizing Economy
Premium
Office man finger touch hud, virtual screen with stock market changes, business candlesticks graph chart. Double exposure of blue and white lines, growing numbers, online trading
Financial Data with Trend Lines and Bar Charts
Digital Infographic of Stock Market Data Overlaying Urban Scene
Dynamic Stock Market Graph with Percentage Indicators
Financial Data Processing Over Digital Grid
Premium
Histogram and lines economic chart on modern architecture background
Futuristic Business Data Graphs over City Skyline
Financial Data Charts Over Belgian Flag Illustrating Global Economy
Abstract Financial Graph Displayed on Office Monitor
Dynamic Financial Data Analysis Charts with Green Digital Grid
Premium
A hand holds a financial graph displaying upward market trends from 2021 to 2025 with candlestick patterns, on a dark background, symbolizing financial forecasting and future growth
Futuristic Data Dashboard Overlaying Scenic Nature Landscape
Physician Examining Infant with Data and Technology Overlays
Healthcare Professional Examining Digital Data Analytics with Metrics Overlay
Dynamic Data Dashboard with Global Analytics Visualization
Premium
Panoramic photo of laptop with financial charts at screen, mockup for announcement, advertising. Top view, female hands lie on a laptop keyboard with a graphs at white screen, typing text. Copy-space
Neon Financial Dashboard Overlay on Urban Glass Towers Showing Stock Trends and Analytics
Projecting Financial Data Over Urban Skyline Showing Rising Market Trends and Analytics
Business Team Analyzing Financial Data with Interactive Charts and Graphs in Modern Office
Financial Data Overlaid on Warehouse Representing Trade and Logistics
Dynamic Financial Data Displayed Over Cityscape Background
Financial Data Overlay on Modern Cityscape Illustrating Market Trends
Premium
Financial data on a monitor
Futuristic Architecture with 6G Technology Graph Overlay
Abstract Financial Data Display with Analytical Graphs
Financial Graphs Overlay on Cityscape Featuring Global Economy Theme
Dynamic Financial Graph Analyzing Market Trends
Premium
Male trader sits at desk hold smart phone with stock market data, using laptop display graph and chart, analyzing investment, check trading stocks information, view over shoulder. Growth, profit, apps
Financial Data Analysis with Cityscape Background
Futuristic Graphs Over Cityscapes Indicating Global Financial Data Trends
Digital Data Overlay on Urban Street Scene
Financial Data Overlaid on City Skyline
Premium
Digital economic growth chart with a rising trend towards 2025, symbolizing future market predictions.
Financial Data Graphs Overlaying Urban Skyline
Financial Charts Over Cityscape Reflecting Economic Trends
Financial Data Processing with Blue Background Overlay
Abstract Financial Data Over Cityscape Imagery
Premium
Earth sphere hologram with candlesticks and growing lines. Panoramic Bangkok cityscape at night. Concept of forex and investment, online trading and global market
Global Financial Data Analysis on Grid Background
Financial Data Analysis with Dynamic Growth Charts
Global Financial Data Analysis with Dynamic Graphs on World Map
Abstract Data Flow on Heartbeat Monitor Grid Background
Premium
Financial graph with a red falling trend line overlay on a cityscape background, symbolizing a market downturn and financial crisis
Futuristic Dashboard with Neon Line Graphs and Digital Interface
Declining Financial Graph with Urban Backdrop and Grid Overlay
Digital Dashboard Displaying Financial Chart and Analytics Interface
Sustainability Finance Dashboard Displaying CO2 Emissions, Euro Trends and Growth Metrics
Premium
chart, diagram, graph, index, invest, marketing, growth, analytics, opportunity, analysis. A man is drawing a graph on a laptop, with a line is pointing upwards. The graph is showing a positive trend.
Market Dashboard Showing Downward Arrow Over Candlestick Charts and Percentage Labels
Rocky Lakeshore at Dusk Overlaying Financial Charts and Rising Line Graphs
Financial Analytics with Graphs and Data on Digital Interface
Financial Data Analytics Over Urban Skyline Concept
Financial Graphs with Cityscape Background Reflecting Market Trends
Dynamic Financial Data Processing Showing Stock Market Interface
Premium
Stock market changes, business chart with changing lines and numbers. Double exposure with building skyscrapers in Singapore. Concept of forex and online trading
Cityscape Overlaid with Financial and Stock Market Data
Financial Analysis in Modern Office Environment
Financial Data Processing with Global Business Analytics
Holographic Battery Icon Over Stock Market Trading Board
Premium
Visualizing central data analytics on digital interface, with pie charts bar graphs formulas. Futuristic, technology, visualization, infographics, digital, scientific, analytical
Dynamic Financial Graphs Illustrating Market Trends and Data
Dynamic Financial Data Analyzing with Graph Overlays
Financial Graphs Overlaying Cityscape Illustrate Global Economy
Global Financial Data Visualization with Digital Overlays
Premium
Rising glow arrows on white stairway as business chart steps on grid, blue background. Business economic and marketing growth graph process, higher goal, success, profit, financial investment concept.
Financial Data Processing with Analytics Overlay
Stock Market Trends Overlaid on Skyscraper Skyline
Global Financial Data Trading Analytics Over Flames Concept
Financial Analytics and Growth Over Comoros Flag Background
Premium
Business chart with uptrend line graph, bar chart and stock numbers in bull market on white and blue color background (vector)
Financial Data Visualization with Dynamic Graphical Analysis
Digital Data Analysis on World Map Grid with Global Connectivity
Futuristic Financial Dashboard with Charts and Data Visuals
Interactive Financial Dashboard with Line Graphs and Analytics
Premium
Close-up rear view of young business woman working in office interior on pc holding smartphone and looking at screen with diagrams. Office person using mobile phone and laptop
Global Financial Data Visualization with Charts and World Map
Financial Data Visualization with Charts and Graphs Showing Market Trends
Smiling Businessman Blending with Financial Dashboard Overlay Showing Growth Analytics
Global Financial Market Analytics Dashboard Showing Bar Charts and Trend Lines
Premium
Trader analyzing data on virtual screen.Price graph and indicator. Stock market invest and crypto currency. Stock market and business investment.
Candlestick and line market chart visualizing stock performance with percentage gain labels