
- Home >
- Stock Photos >
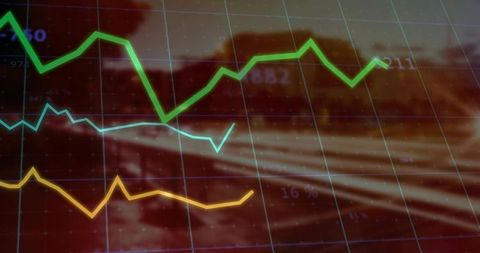
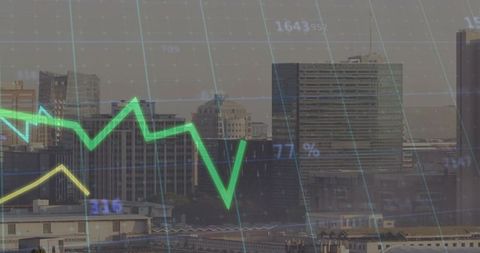
- Dynamic Financial Data Graphs with Holographic Styles
Dynamic Financial Data Graphs with Holographic Styles Image

Depicting multiple graphs with shifting numbers on a textured grid, this digital visualization represents economic and financial trends. Useful for presentations relating to data analysis, trading strategies, economic forecasts, or corporate reports, providing a high-tech, data-driven aesthetic.
Powered by 


downloads
Tags:
More
Credit Photo
If you would like to credit the Photo, here are some ways you can do so
Text Link
photo Link
<span class="text-link">
<span>
<a target="_blank" href=https://pikwizard.com/photo/dynamic-financial-data-graphs-with-holographic-styles/4ff7abb4851545bc3f85ffd37cbb61c6/>PikWizard</a>
</span>
</span>
<span class="image-link">
<span
style="margin: 0 0 20px 0; display: inline-block; vertical-align: middle; width: 100%;"
>
<a
target="_blank"
href="https://pikwizard.com/photo/dynamic-financial-data-graphs-with-holographic-styles/4ff7abb4851545bc3f85ffd37cbb61c6/"
style="text-decoration: none; font-size: 10px; margin: 0;"
>
<img src="https://pikwizard.com/pw/medium/4ff7abb4851545bc3f85ffd37cbb61c6.jpg" style="margin: 0; width: 100%;" alt="" />
<p style="font-size: 12px; margin: 0;">PikWizard</p>
</a>
</span>
</span>
Free (free of charge)
Free for personal and commercial use.
Author: Awesome Content
Similar Free Stock Images

Premium


Premium

Premium


Premium


Premium


Premium


Premium


Premium


Premium

Premium


Premium


Premium


Premium


Premium


Premium


Premium


Premium


Premium

Premium


Premium


Premium


Premium

Premium


Premium


Premium

Explore More Free Stock Images