- Home >
- Stock Photos >
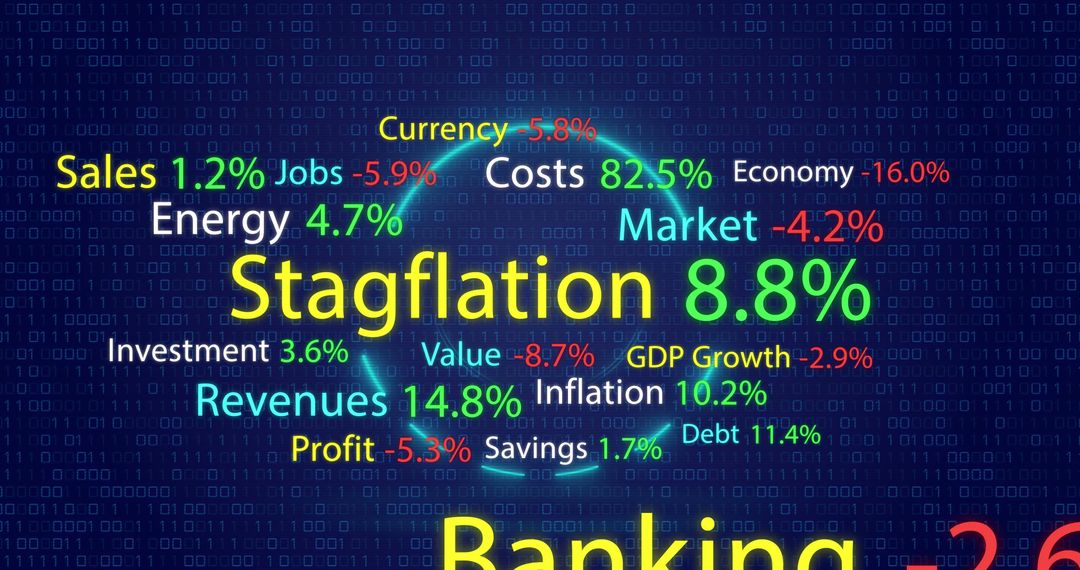
- Dynamic Financial Data Illustration with Statistical Analysis
Dynamic Financial Data Illustration with Statistical Analysis Image
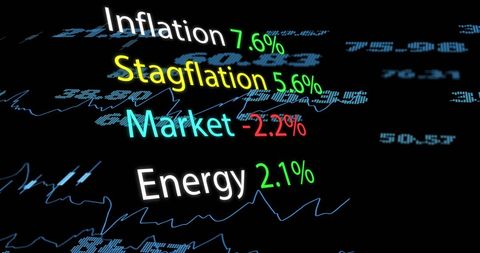
This image portrays financial data related to inflation, stagflation, market, and energy projected onto a dark background. Bright text displays various percentages, highlighting changes in economic indicators. Suitable for illustrating articles or resources focused on economics, market analysis, data science, finance trends, or statistical reviews. Can also enhance presentations related to fiscal policy and global economics decisions.
Powered by 


2
downloads
downloads
Tags:
More
Credit Photo
If you would like to credit the Photo, here are some ways you can do so
Text Link
photo Link
<span class="text-link">
<span>
<a target="_blank" href=https://pikwizard.com/photo/dynamic-financial-data-illustration-with-statistical-analysis/17102c1116394119614bae112942f6a6/>PikWizard</a>
</span>
</span>
<span class="image-link">
<span
style="margin: 0 0 20px 0; display: inline-block; vertical-align: middle; width: 100%;"
>
<a
target="_blank"
href="https://pikwizard.com/photo/dynamic-financial-data-illustration-with-statistical-analysis/17102c1116394119614bae112942f6a6/"
style="text-decoration: none; font-size: 10px; margin: 0;"
>
<img src="https://pikwizard.com/pw/medium/17102c1116394119614bae112942f6a6.jpg" style="margin: 0; width: 100%;" alt="" />
<p style="font-size: 12px; margin: 0;">PikWizard</p>
</a>
</span>
</span>
Free (free of charge)
Free for personal and commercial use.
Author: Awesome Content
Similar Free Stock Images

Premium


Premium


Premium


Premium


Premium


Premium


Premium


Premium


Premium


Premium


Premium


Premium


Premium


Premium


Premium


Premium


Premium


Premium


Premium


Premium


Premium


Premium


Premium


Premium