
- Home >
- Stock Photos >
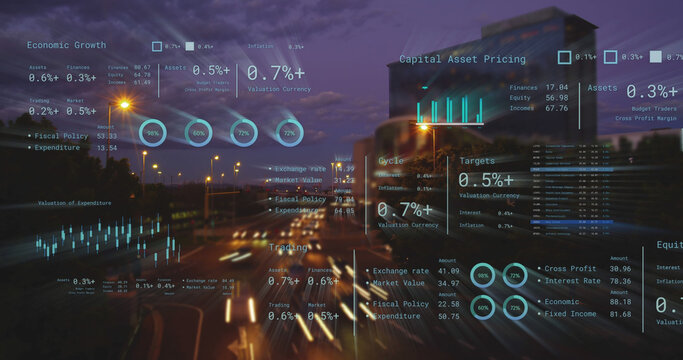
- Dynamic Financial Data Integration with Global Perspective
Dynamic Financial Data Integration with Global Perspective Image

Visual depicting the intersect of financial data trends and global business operations. Highlights digital graphs overlayed on global imagery. Ideal for representing topics in financial analytics, economic forecasts, digital transformation in banking, or international corporate strategies.
Powered by 


downloads
Tags:
More
Credit Photo
If you would like to credit the Photo, here are some ways you can do so
Text Link
photo Link
<span class="text-link">
<span>
<a target="_blank" href=https://pikwizard.com/photo/dynamic-financial-data-integration-with-global-perspective/384afd676c57fe5ee35a38eb2a73aa7e/>PikWizard</a>
</span>
</span>
<span class="image-link">
<span
style="margin: 0 0 20px 0; display: inline-block; vertical-align: middle; width: 100%;"
>
<a
target="_blank"
href="https://pikwizard.com/photo/dynamic-financial-data-integration-with-global-perspective/384afd676c57fe5ee35a38eb2a73aa7e/"
style="text-decoration: none; font-size: 10px; margin: 0;"
>
<img src="https://pikwizard.com/pw/medium/384afd676c57fe5ee35a38eb2a73aa7e.jpg" style="margin: 0; width: 100%;" alt="" />
<p style="font-size: 12px; margin: 0;">PikWizard</p>
</a>
</span>
</span>
Free (free of charge)
Free for personal and commercial use.
Author: Awesome Content
Similar Free Stock Images

Premium


Premium

Premium


Premium


Premium


Premium


Premium


Premium


Premium


Premium


Premium


Premium


Premium


Premium


Premium


Premium


Premium


Premium


Premium


Premium


Premium


Premium


Premium


Premium


Premium


Explore More Free Stock Images