
- Home >
- Stock Photos >
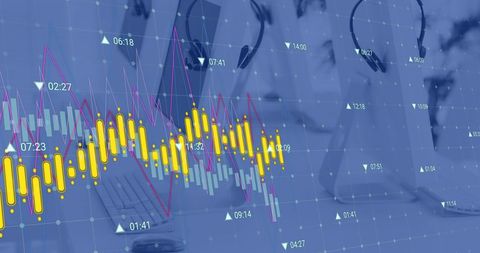
- Dynamic Financial Data on Digital Display Canvas
Dynamic Financial Data on Digital Display Canvas Image
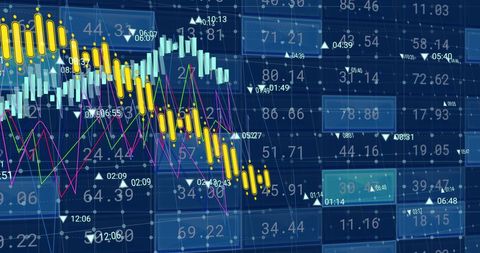
Captures vibrant financial data streams on a digital canvas, reflecting global markets and economic activities. Useful for illustrating concepts in international finance, forex trading, or market behaviors in digital media and economic reports.
Powered by  - Get 15% off with code: PIKWIZARD15


downloads
Tags:
More
Credit Photo
If you would like to credit the Photo, here are some ways you can do so
Text Link
photo Link
<span class="text-link">
<span>
<a target="_blank" href=https://pikwizard.com/photo/dynamic-financial-data-on-digital-display-canvas/bd1ed8a65b11f64abbeaed64fc7df370/>PikWizard</a>
</span>
</span>
<span class="image-link">
<span
style="margin: 0 0 20px 0; display: inline-block; vertical-align: middle; width: 100%;"
>
<a
target="_blank"
href="https://pikwizard.com/photo/dynamic-financial-data-on-digital-display-canvas/bd1ed8a65b11f64abbeaed64fc7df370/"
style="text-decoration: none; font-size: 10px; margin: 0;"
>
<img src="https://pikwizard.com/pw/medium/bd1ed8a65b11f64abbeaed64fc7df370.jpg" style="margin: 0; width: 100%;" alt="" />
<p style="font-size: 12px; margin: 0;">PikWizard</p>
</a>
</span>
</span>
Free (free of charge)
Free for personal and commercial use.
Author: People Creations
Similar Free Stock Images

Premium


Premium

Premium


Premium

Premium


Premium


Premium


Premium


Premium


Premium


Premium

Premium


Premium


Premium

Premium

Premium

Premium


Premium


Premium

Premium


Premium


Premium


Premium


Premium

Premium

Explore More Free Stock Images