- Home >
- Stock Photos >
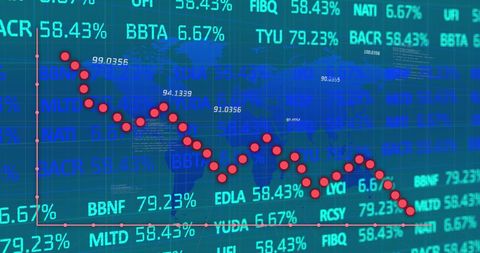
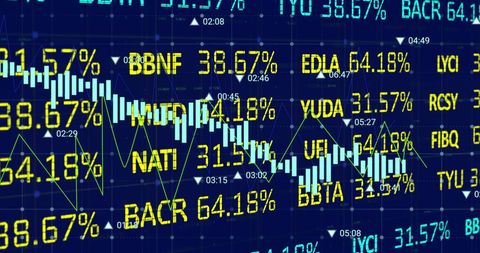
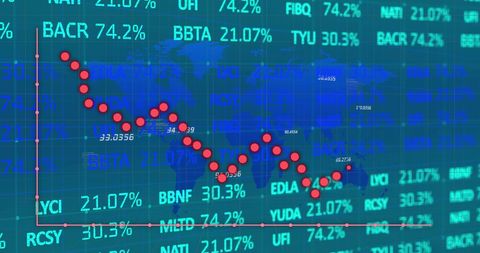
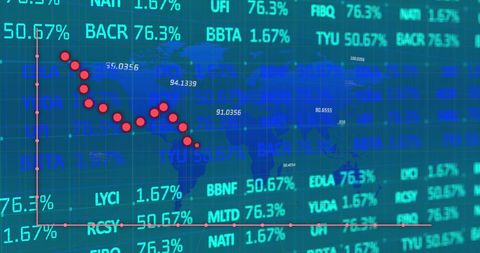
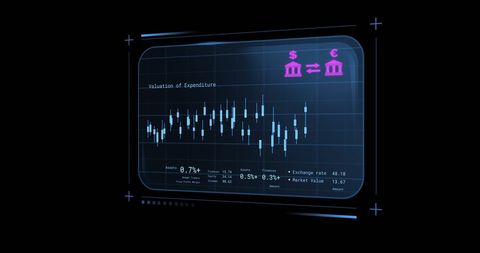
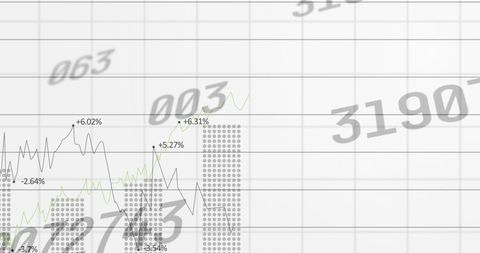
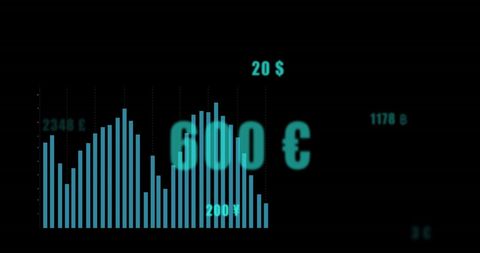
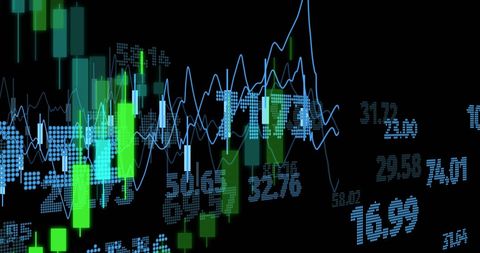
- Dynamic Financial Data on World Map Background
Dynamic Financial Data on World Map Background Image
Digitally rendered numbers displayed over a conceptual world map on a black background, symbolizing financial data and global networks. This can be used as a visual representation of business and finance concepts, making it ideal for presentations, reports, websites, or promotional materials related to financial technology, data analysis innovations, and global economics.

downloads
Tags:
More
Credit Photo
If you would like to credit the Photo, here are some ways you can do so
Text Link
photo Link
<span class="text-link">
<span>
<a target="_blank" href=https://pikwizard.com/photo/dynamic-financial-data-on-world-map-background/898c819400a559a0d888e38d74989ed1/>PikWizard</a>
</span>
</span>
<span class="image-link">
<span
style="margin: 0 0 20px 0; display: inline-block; vertical-align: middle; width: 100%;"
>
<a
target="_blank"
href="https://pikwizard.com/photo/dynamic-financial-data-on-world-map-background/898c819400a559a0d888e38d74989ed1/"
style="text-decoration: none; font-size: 10px; margin: 0;"
>
<img src="https://pikwizard.com/pw/medium/898c819400a559a0d888e38d74989ed1.jpg" style="margin: 0; width: 100%;" alt="" />
<p style="font-size: 12px; margin: 0;">PikWizard</p>
</a>
</span>
</span>
Free (free of charge)
Free for personal and commercial use.
Author: People Creations