1. Home > 
  2. Stock Photos > 
  3. Dynamic Financial Data Over Abstract Background

Dynamic Financial Data Over Abstract Background Image

Dynamic Financial Data Over Abstract Background

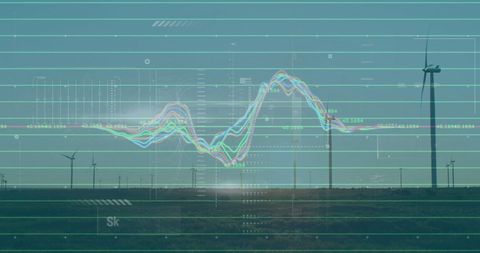
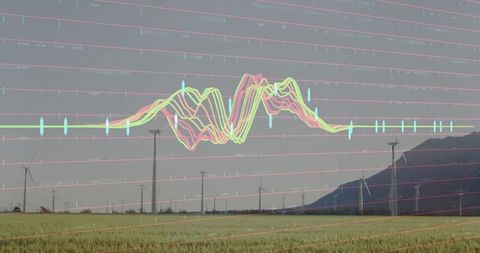
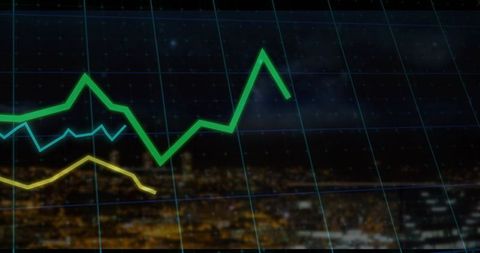
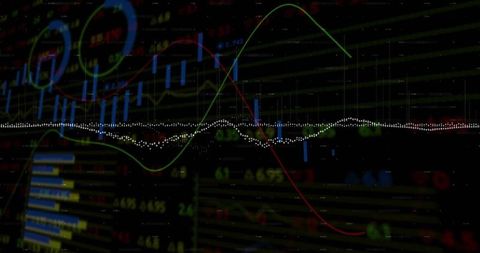
Vivid illumination intertwines with digital graphs representing complex financial data on a dark backdrop. This scene epitomizes the blend of technology with global economic trends, ideal for illustrating financial analytics, economic studies, or technology-driven finance initiatives. Perfect for usage in articles and presentations on finance, the stock market, or economic simulations.

Powered by Adobe logo
Abstract representation of financial growth with glowing graphs and data patterns in dark background - Powered by AdobeData analytics and graphs. Analysis of statistical business marketing data. Data scientist using laptop computer to analyze data - Powered by AdobeA professional analyzing financial data using a digital tablet with dynamic charts and graphs. - Powered by AdobeAn analyst uses a computer and dashboard for data business analysis and Data Management System with KPI and metrics connected to the database for technology finance, operations, sales, marketing  - Powered by AdobeBusiness professionals collaborating and analyzing financial data on a laptop with charts and graphs during a meeting - Powered by Adobe

Credit Photo

If you would like to credit the Photo, here are some ways you can do so

Free (free of charge)

Free for personal and commercial use.

Author: People Creations

Similar Free Stock Images

Dynamic Stock Market Concept with Colorful Line Graphs
Premium
A corporate data management expert analyzing real-time financial and business data on a large digital screen, showcasing market trends, analytics, and strategic insights in a modern office
World Map with Falling Line Graphs Indicating Global Economic Decline
Futuristic Data Visualization Oscillation Concept
Dynamic Stock Market Data Visualization on Digital Screen
Dynamic Stock Market Analysis with Trend Lines
Premium
Business finance data analytics graph.Financial management technology.Advisor using KPI Dashboard on virtual screen.
Dynamic Financial Graph Analyzing Market Trends
Financial Data Visualization and Digital Analysis Concept
Dynamic Data Analysis over Virtual Grid with Neural Patterns
Financial Data Processing Over Digital Cityscape
Premium
Data analytics and big data strategy for real-time analytics, predictive data modeling, business intelligence analytics, and data-driven decision-making in modern digital businesses. Thunk
Financial Data Visualization with Network of Connections
Abstract Network Connections with Financial Data Overlay
Financial Data Overlaid on City Skyline
Graphical Data Analysis on Digital Interface
Premium

Dynamic blue and green digital stock market graph with bar charts and lines on a dark background, representing financial data analysis, investment trends, business growth, and global economy fluctuat
Data Trends Overlayed on Cityscape Skyscrapers
Abstract Financial Data Interface with Dynamic Chart Lines
Stock Market Decline with Red Graph Showing Slump in Financial Markets
Digital Data Analysis Concept with Colorful Wave Graphs
Premium
Analyzing financial data with a magnifying glass, examining growth, trends, and performance metrics for strategic decision making.
Financial Market Decline with Red Line Graph Overlay
Digital Data Processing and Global Connectivity Illustrated
Global Financial Data with Dynamic Analytics Visualization
Digital Data Analysis on Futuristic Black Background
Premium
Magnifying glass over financial charts and graphs showing data analysis and growth
Green Line Graph Over Urban Skyline Data Visualization
Colorful Data Waveforms on Digital Analytics Dashboard Interface
Abstract Neon Waveforms on Digital Grid Layout
Futuristic Digital Dashboard with Neon Line Charts Analysis
Dynamic Stock Market Graph Display on Digital Grid
Colorful Stock Market Graph with Data on Grid
Premium
Colorful digital screen with glowing forex and stock market candlestick chart and data analysis on dark interface background for modern financial display. 3D Rendering
Dynamic Financial Data Streams for Market Analysis
Dynamic Stock Market Analytics Display on Blue Background
Green Line Rising on Digital Trading Board with Abstract Background
Dynamic Financial Graph on Digital Background
Premium
A model airplane is positioned on top of colorful financial reports that display analytical graphs and data concerning the airline industry. This setup represents business discussions
Interactive Financial Data Analysis with Digital Technology
Dynamic Financial Stock Market Display with Analytical Data
Digital Data Processing on Interconnected Network
Abstract Financial Data Visualization with Multicolored Graphs
Premium
Analyzing financial charts and data reports in modern office setting
Glowing Data Graph Overlay on Spinning Black Globe
Digital Soundwaves and Traffic in Silhouette Cityscape
Futuristic Digital Data Graphs and World Map
Futuristic Data Analysis Overlaying Cityscape Digital Interface
Premium
Businessman analyzing financial data on futuristic digital screen with graphs and charts on a dark background, showcasing the finance growth concept.
Dynamic Stock Market Data Analysis With Graphs and Percentages
Dynamic Chart Highlighting Real-Time Data Trends
Dynamic Data Graph on Dark Digital Grid Background
Colorful Financial Data Visualization on Dark Grid
Premium
Tractor harvesting wheat in field with financial graphs overlay illustrating agricultural economics
Global Stock Market Analysis with Digital Interface Over World Map
Digital Finance Graph with Data Points on Dark Background
Abstract Data Visualization with Retro Future Digital Interface
Futuristic Data Visualization on Global Map Interface
Premium
Interactive Data Analysis and Forecasting. Business and finance concept.
Colorful Digital Waveform with Analytical Overlay and Red Grid Lines
Financial Market Data with Stock Candlestick Chart and Indicators
Woman Engaged in Data Analysis on Laptop with Overlayed Charts
Dynamic Stock Market Graph with Vibrant Color Lines on Grid
Financial Data Analysis with Vibrant Lines on Blue Background
Futuristic Financial Graphs with Dynamic Green Line
Premium
Two glowing spheres with financial graphs inside balance on a seesaw, representing comparison and equilibrium in data or market analysis.
Falling Stock Market Graph with Data on Black Screen
Dynamic Global Financial Data Display with World Map
Global Data Analytics and Stock Market Visual Interface
Dynamic Multicolored Graphs on Abstract Digital Finance Background
Premium
A silhouette of a man in a suit against a vibrant city skyline, overlaid with colorful financial graphs, depicting a sense of analytics and business growth.
Dynamic Analysis of Stock Market Trends and Patterns
Cyber Security with Data Wave and Digital Padlock Scanner
Dynamic Financial Data Analyzing with Graph Overlays
Financial Data and Network Connections Over Black Background
Premium
Manager touches growth graph on analytics dashboard. Business data analysis reports with marketing finance management strategy. Digital charts graphs increase business performance, sales statistic
Dynamic Financial Data Charts in Modern Office Background
Dynamic Data and Graphs on Digital Screen
Futuristic Data Analysis Interface with Dynamic Graphs
Data Visualization on Blue Digital Interface
Premium
Businesswoman Managing Company Data Using Analytics Dashboard
Financial Data and Stock Market Trends Overlaying Cityscape
Abstract Financial Data Streaming Over World Map Visualization
Abstract Robotic Arm Analyzing Digital Financial Graphs for AI-Based Trading
Financial Data Analysis with Growing Stock Trends
Premium
Digital financial stock market chart with glowing bar graphs and data analysis on a blue background.
Digital DNA Strand Over Global Map Representing Data Transmission
Futuristic Digital Interface with Upward Trend Graph and C++ Code
Futuristic Data Visualization over Renewable Energy Landscape
Rising Green Financial Line Graph with Data Annotations
Premium
Green arrow pointing upward on financial graph. Business growth chart with rising trend line. Digital stock market data visualization for investment analysis
Innovative Digital Analysis Waveform with Futuristic Interface
Neon waveform bundle oscillating across futuristic digital dashboard with grid and data markers
Colorful Stock Market Graph on Dark Grid Background Illustrating Global Economy Trends
Dynamic Financial Market Trends with Data Visualizations
Abstract Data Analysis Overlay on Coastal Landscape
Dynamic Green Stock Chart on Digital Grid Background
Premium
Representation of data analytics,charts, graphs and data driven insights emerging from a sea of information
Financial Graph Overlaying Retail Store Backdrop Visualizing Market Trends
Abstract Digital Market Analysis with Financial Charts
Colorful Stock Market Data with Infographics
Dynamic Digital Market Analysis with Holographic Data
Premium
Business report showing charts and graphs on a clipboard for data analysis on transparent background
Dynamic Colorful Waves on Black Digital Background
Data Visualization Energy Management with Wind Turbines
Digital Network Connections and Financial Data Analysis
Dynamic Financial Data Displayed on Neon Graphs
Premium
Data analyzing and stock market visualization with digital charts, financial dashboards, and performance metrics. Ideal for investment analysis, trading strategy, and economic forecasting.
Dynamic Digital Data Display with Vibrant Graphs
Abstract Financial Data Streams Over Cityscape Background
Dynamic Neon Lines with Data Streams Over Digital Grid
Dynamic Stock Market Graph on Digital Interface
Premium
Stock market graph with blue technology background, financial trading analysis chart, investment growth data visualization, economic business concept
Financial Market Data Visualization with Global Chart Overlay
Digital Interface with Data Processing and Security Elements
Digital Data Waveform on High-Tech Interface
Abstract Data Wave Patterns on Technology Interface
Premium
Person using tablet displaying holographic financial charts and graphs financial data analytics
Financial Trading Chart Overlaying World Map with Red Trend Line
Dynamic Financial Data Visuals on Futuristic Neon Interface
Animated Waveform and Icons on Digital Interface for Analytics
Dynamic Data Visualization with Neon Line Graphs Against Cityscape
Premium
Transparent or png stock market investment trading graph growth.Trade business analytics graph and financial chart.
Neon Binary Waveform Dashboard Visualizing Real-Time Data Stream and Signal Patterns