1. Home > 
  2. Stock Photos > 
  3. Dynamic Financial Data Over Grid Background for Global Analysis

Dynamic Financial Data Over Grid Background for Global Analysis Image

Dynamic Financial Data Over Grid Background for Global Analysis

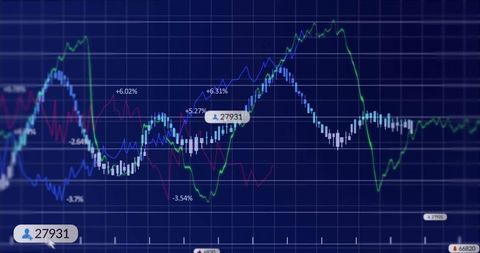
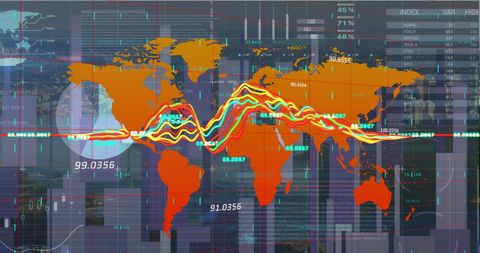
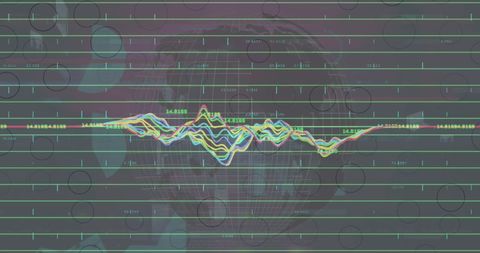
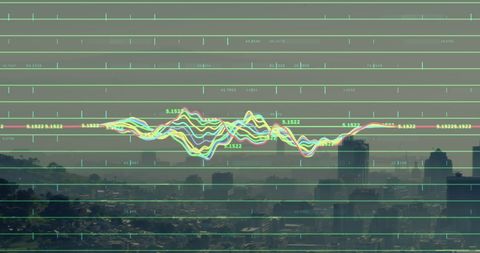
Colorful multidimensional graphs over a quantified grid background suggest focus on global market analysis or explaining complex economic trends. Useful for advertisements in financial media, blog posts analyzing market dynamics and educational presentations around economic study or statistics courses.

Powered by Shutterstock logo - Get 15% off with code: PIKWIZARD15
Concept of Grid Trading write on paperwork isolated on Wooden Table. - Powered by Shutterstock - Get 15% off with code: PIKWIZARD15Image of financial data processing over grid on black background. Global finance, business, connections, computing and data processing concept digitally generated image. - Powered by Shutterstock - Get 15% off with code: PIKWIZARD15Creative digital globe with forex chart on blurry city background with skyscraper. Global trade and growth concept. Double exposure - Powered by Shutterstock - Get 15% off with code: PIKWIZARD15Displaying 3D Earth globe rotating over trading grid, with scrolling tickers and line charts. Globe, finance, data, technology, investment, analytics, digital - Powered by Shutterstock - Get 15% off with code: PIKWIZARD15Creative digital globe with forex chart on blurry city background with skyscraper. Global trade and economy concept. Double exposure - Powered by Shutterstock - Get 15% off with code: PIKWIZARD15

Credit Photo

If you would like to credit the Photo, here are some ways you can do so

Free (free of charge)

Free for personal and commercial use.

Author: Awesome Content

Similar Free Stock Images

Vibrant Data Visualization with Flowing Line Graphs and Shifting Numbers
Premium
Creative glowing business chart and map on blurry city background. Stock, global finance growth and financial graph concept. Double exposure
Data Processing with Digital Interface and Code Background
Premium
Stock market concept and background. Market report on blue background. Financial graph on a computer monitor screen. Market analysis for variation report of share price. Background stock chart.
Premium
Global business financial index background of successful investment with graph and chart in perspective view.Earth image furnished by NASA.
Digital Globe with Intersecting Graphs Representing Global Economy
Abstract Digital Data Charts Graphs on Dark Grid Background
Global Digital Interface with Interactive Data Visualization
Global Financial Data Visualization Over World Map
Premium
Displaying map outline over data interface showing candlesticks line graphs and circular highlight. Global, analytics, infographic, finance, technology, digital, investment
Financial Graph Analyzing Stock Market Trends
Financial Data Analysis with Stock Market Graphs
Dynamic Stock Market Data and Cityscape Background
Futuristic Data Visualization with Teal Grid Interface and Waveform Lines
Premium
Displaying globe icons encircled by arrows floating over skyline, with candlestick charts, tickers. Globalization, connectivity, finance, trading, technology, urban, digital
Financial Data Overlay on Modern Skyscraper
Digital Finance Art with Graphs and Currency Symbols Overlapping
Financial Data Visualization Overlaying City Skyscraper
Digital Data Visualization Over World Map in Network Concept
Premium
Red dotted line graph trending downward across 3D grid in dashboard, with blue point-cloud globe. Data visualization, financial analytics, futuristic design, digital dashboard, global economy, market
Dynamic Financial Data Visual Display with Graph Annotations
Digital Stock Market Data Over Cityscape Concept
Business Professionals in Futuristic Data Environment
Global Data Analytics with World Map and Bar Graph
Premium
Close up of bank cards on desk with growing green forex chart and arrows on blurry background. Index, finance and market growth concept. Double exposure
Global Financial Data Analysis with Digital World Map Visualization
Stock Market Analysis and Data Processing Graphic
Financial Analytics Displaying Over Modern Office Environment
Stock Market Trends and Data Analysis over Digital Grid
Premium
Displaying dark interface showing tickers with % values, yellow graph and map, glowing RANSOM text. Technology, cyber security, data visualization, digital environment, futuristic, finance, analytics
Data Processing and Business Analytics Visualization
Futuristic 3D Financial Dashboard Displaying Neon Cyan Orange Line Charts with Grid View
Dynamic Stock Market Graphs Showing Fluctuating Trends
Financial Graphs with Globally Inspired Data Visualization
Digital Financial Graphs and Market Data Analysis
Abstract Financial Growth Chart with Rising Bars and Line Graphs
Global Financial Market Trends on Digital Screen
Premium
Close up of female hand using tablet at desktop with forex chart on blurry background with grid. Trade, finance and market concept. Double exposure
Premium
Image of graphs processing data over 3d grid on black background. Global communication, business, finance and data interface concept digitally generated image.
Premium
Standing man in suit, tie overseeing Earth globe in data grid, with binary code and candlesticks. Digital, finance, technology, data, analytics, business, economic
Fluctuating Stock Chart Overlay in Modern Office Environment
Stock Market Analysis with Graphs and Trading Data
Financial Data Display Over Modern Office Architecture
Global Financial Data and Stock Market Visualization
Premium
Rotating Earth globe showing stock tickers and charts in virtual market, with skyscraper silhouette. Futuristic, global, financial, technology, data visualization, digital, corporate
Complex Financial Graphs Showing Market Changes and Data Analysis
Digital Interface Overlaying Urban Financial Data Visualization
Financial Data Visualization with Red Downtrend Line in Virtual Environment
Digital Financial Chart Showing Growth and Dynamic Indicators
Premium
Image of changing numbers and financial data processing against office desk. Global finance and business technology concept
Dynamic Data Visualization on Digital Dashboard Display
Dynamic Stock Market Graph Fluctuating in Modern Office
Futuristic Financial Data Analysis with Rising Stock Chart
Premium
Displaying green bars red trend line, candlestick-line charts on world map in grid terminal display. Financial technology, data visualization, digital interface, stock market, global analytics,
Neon Multicolor Waveform Displaying on Tech Dashboard with Teal Gridlines and Hex Icons
Abstract Data Visualization with Neon Waveforms
5G 6G Digital Interface With Global Connectivity Graphs
Digital Data Analysis Concept with Colorful Wave Graphs
Dynamic Business Data Visualization on Modern Office Building
Global Financial Data Analysis over World Map with Graphs
Colorful Financial Graphs on Digital Screen with Globe
Financial Data Visualization with Increasing Graph Trend
Premium
Close up of businessman hand pointing at creative business graph with index and grid on blurry city background. Stock market and financial statistics concept. Double exposure
Dynamic Financial Data Analytics and Stock Market Trends
Digital Data Analysis on Futuristic Black Background
Premium
Close up of laptop computer with bank card on keyboard, growing upward chart, map, arrows and forex graph on blurry background. Global trends, trading and finance concept. Double exposure
Financial Data Analysis with Abstract Graphics
Green Financial Data Line Graph Over Cityscape Background
Red Line Graph Overlaying Office Computers Symbolizing Data Analysis
Financial Data Analysis with Cityscape Background
Global Finance and Economy Interface with Digital Graphs
Financial Graphs and Digital Data on Dark Background
Global Finance Interface Over Modern Cityscape
Global Data Tracking on Digital World Map
Financial Data Analysis on World Map Background
Premium
Image of green line graphs moving on globe with grids against office building interior. Digital composite, global business, technology, finance, economy, development, architecture.
Digital Holographic Data Interface Display
Global Financial Data and Digital Interface Visualization
Digital Data Analysis and Global Financial Market Indicators
Financial Data Display with Urban Reflections Overlay
Global Data Processing With World Map and Charts
Dynamic Financial Charts on Global Digital Grid Background
Global Stock Market Analysis with Digital Graph Overlay
Business Data Analysis with Red Declining Graph on Office Desk Background
Premium
Multi exposure of abstract virtual graphic data spreadsheet sketch on a modern furnished classroom background, analytics and analysis concept
Financial Data Visualization Above Cityscape
Premium
Displaying candlestick chart bars and purple dotted trend arrow on data interface, with world map. Finance, data visualization, digital interface, analytics, technology, innovation, business
Financial Data Graph Overlay with Technological Elements
Dynamic Financial Graphs and Charts on Black Background
Colorful Data Visualization with Social Icons on Neon Grid Screen
Premium
Close up of laptop on desk with coffee cup, notepad and creative business graph with index and grid on blurry background. Stock market and financial statistics concept. Double exposure
Premium
Image of financial data processing over solar panel on blue background. Global business, sustainability and solar energy concept digitally generated image.
Global Financial Data Processing with Graphs and Charts Overlay
Analyzing Statistical Data Over Digital Network With Cityscape
Financial Data Over Electric Sky Concept for Energy Sector
Digital Data Visualization with Graph Charts on Dark Background
Financial Data Analytics Over Urban Skyline Concept
Digital Finance Data Processing Over Urban Office Building
Stock Market Graph and Data Analysis
Digital Financial Data Analysis Over Modern Server Center
Dynamic Stock Market Analysis with Trend Lines
Animated Stock Market Data Over Cityscape
Downward Trending Graph with Office Background
Glowing Data Graph Overlay on Spinning Black Globe
Financial Data Projection Over Cityscape in Digital Interface
Premium
Image of data processing with statistics over grid. Global business, finances, computing and data processing concept digitally generated image.
Futuristic Global Data Analytics with World Map Overlay
Financial Data Visualization Against Glass Office Facade
Dynamic Financial Data Analysis Concept with Graph Lines and Orange Background
Global Data Processing with Digital Maps and Graphs
Premium
Map with forex candlestick index on blurry night city background. Global trade and market concept. Double exposure
Premium
Displaying translucent blue world map overlay on financial data interface, with stock tickers. Data visualization, financial technology, digital trading, market analysis, global economy, data
Global Data Analytics with Interactive World Map and Diagrams
Analytical Trading Dashboard with Rising Candlestick Charts
Dynamic Data Streams with Code Overlay on Digital Interface
Colorful Graph Analysis in Digital Interface Over Blue Background
Global Financial Data Analytics with Graphs on World Map
Dynamic Financial Data Displayed on Neon Graphs
Financial Data Overlay on Glass Office Building
Digital Security with Data Visualization Elements
Premium
Close up of male finger pointing at creative candlestick forex chart with index on dark background. Trade, finance and stock exchange concept. Double exposure
Colorful Data Graphs Overlaying Modern Cityscape
Abstract Data Visualization with Dynamic Line Charts on Dark Background
Global Finance and Technology Concept with Dynamic Charts
Data Processing with Virtual Grid and Cloud Imagery
Explore More Free Stock Images