1. Home > 
  2. Stock Photos > 
  3. Dynamic Financial Data Over Grid Background

Dynamic Financial Data Over Grid Background Image

Dynamic Financial Data Over Grid Background

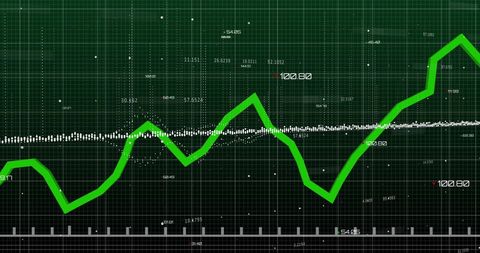
Depicts financial data as a digital green line graph overlaid on a gridded dark background, representing growth trends and analytics. Useful for illustrating topics related to finance, stock market fluctuations, economic analysis, investment strategies, or digital transformation in business.

Powered by Adobe logo
Financial graph with declining trend lines and stock market data on green background - Powered by AdobeDigital glowing earth globe in dark environment with abstract green financial data graph background - Powered by AdobeClose-up of a digital stock market display showing increasing energy sector prices and various financial data with green up arrows - Powered by AdobeDynamic glowing green stock market graph ascends, symbolizing financial growth and positive economic trends with bokeh lights. - Powered by Adobebusiness graph with green arrow - Powered by Adobe

Credit Photo

If you would like to credit the Photo, here are some ways you can do so

Free (free of charge)

Free for personal and commercial use.

Author: Authentic Images

Similar Free Stock Images

Digital Data Prozessing with Global Interface Design
Premium
Shattered financial graphs
Abstract Digital Blue Dot Graph with Floating Numbers
Premium
A green arrow pointing upwards on a graph with sell and buy buttons on a dark background with stock market data
Premium
Detailed macro shot of a blue eye reflecting a financial stock market graph on its surface, with red and green analysis lines displayed digitally, under warm lighting.
Financial Data Graphics Over World Map in Digital Style
Digital Data Processing with Chart in Futuristic Interface
Global Data Analytics Over World Map with Numeric Statistics
Innovative Data Analysis with Dynamic Line Graph and Digital Elements
Cityscape with Digital Stock Market Graphs and Statistics
Green Digital Wave Abstract Background with Tech Elements
Digital Data Analysis with Green Line Graph on Grid Background
Rising Graph Line on Digital Green Grid Background
Futuristic Financial Data Visualization on Digital Interface
Digital Data Visualization with Green Graph and Scanning Beams
Rising Financial Graph on Dark Grid Background
Abstract Green Neon Wave Technology Background
Premium
Business data dashboard provide business intelligence analytic for marketing strategy planning brisk with big data set to analyze customer demands and foreseeing business future
Abstract Digital Graph and Code on Violet Background
Digital Finance Chart Overlaying Globe Background
Rising Stock Market Graph on Blue Financial Background
Abstract Digital Data Visualization on Black Background
Premium
The illustration shows a vibrant green arrow graph trending upwards against a dark background with bokeh effects and grid lines, suggesting growth or progress.
Futuristic Financial Data Interface with Digital Waveform
Digital Interface Showing Global Business Data Analytics
Digital Interface with Global Financial Graphs Background
Abstract Technology Chart with Blue Dots on Black Background
Premium
A vibrant green stock market chart features candlestick and bar graphs on a dark background, ideal for woven tapestry design
Digital Financial Graph Over Violet Background in Abstract Style
Financial Growth Stock Nikkei in Urban City Skyline
Graph Lines Portraying Financial Data Trends
Dynamic Financial Graph with Wavy Data Line over Navy Background
Dynamic Financial Data Waves in Digital Cyber World
Futuristic Digital Interface with Light Trails and Technology
Fluctuating Financial Graph on Green Grid Background
Digital Data Stream With Futuristic Green Waveform
Digital Graph Display with Dynamic Flux on Purple Background
Premium
A closeup shot of a stock market ticker displaying fluctuating numbers in green and red, representing financial data and trading
Premium
a neon green arrow going up over a stack of golden cubes
Green Neon Network Waves on Dark Background
Financial Growth Graph on Green Digital Grid Background
Dynamic Financial Chart with Upward Growth Arrow
Futuristic AI Concept with Digital Circuitry and Rising Arrows
Premium
Green stock market graph displays upward trend on digital screen. Finance, economy, business, trading, chart, growth technology information, electronic investment monitor system statistic analysis
Premium
Financial market candlestick chart showing price fluctuations with green and red bars on a dark digital background, representing stock or cryptocurrency trading data.
Financial Data Analysis with Futuristic Technology Interface
Abstract Data Computing with Digital Light Trails
Green Line Graph with Data Points on Grid Background
Abstract Financial Graph with Rising Waves on Red Gradient
Premium
financial analysis and stock crypto trading concept with person typing on laptop and digital graphs overlay
Data Trends and Analysis on 3D Digital Grid
Dynamic Financial Graph on Luminous Green Background
Glowing Cardiology Graph on Dark Background
Dynamic Financial Chart with Data Points on Red Grid Background
Premium
green arrow graph stock market growth up trend concept of business growth stock market profit Stock Illustration
Digital Stock Market Data with Floating Points on Black Background
Digital Graph Displaying Dynamic Data Analysis
Futuristic Digital Graph Showing Data Trends on Analytic Interface
Abstract Digital Wave Displaying Data Processing over Dark Background
Premium
Sculpted bull and bear confront each other amidst a dynamic stock market graph symbolizing financial trends and economic battles
Dynamic Green Light Trails Representing Digital Data Waves
Digital Graphs and Data Visualization on Green Background
Glowing Financial Graph of Stock Market Trends on Digital Screen
Futuristic Digital Representation of DNA Strand
Premium
Green stock market chart displays financial data on digital screen. Candlestick graph indicates trading trends, economic analysis. Technology monitors investment growth, forex prices, market exchange
Stock Market Data Surging Upward on Digital Display
Digital Cardiograph Display with Green Line over Black Background
Digital Financial Data Analytics and Trend Graphs
Dynamic Financial Graphs Overlaying Modern Cityscape
Neon Green Electrocardiogram Wave on Black Background
Premium
Renewable energy sources like solar panels and wind turbines are depicted with a rising stock market graph overlay, symbolizing financial growth and investment in green technology
Premium
Renewable energy landscape with wind turbines and solar panels overlaid with a financial stock market graph symbolizing growth and investment in green technology
Glowing Green Heartbeat Cardiograph on Black Grid
Futuristic Data Analytics Over Technical Blueprint Design
Data Analytics and Financial Growth Indicators
Green Line Graph on Dark Digital Grid
Premium
Green stock market graph with upward trend isolated on white background
Dynamic Green Line Graph Depicting Financial Data
Data Visualization with Rising Red Arrow and Floating Numbers
NFT Financial Data Visualization with Digital Graph Overlay
Dynamic Financial Data Visualizations on Grid Interface
Premium
A 3d business financial graph with a green arrow showing market growth and profit success on a white background illustration of data report sales progress
Digital Financial Data Analyzing Over Circular Grid Display
Colorful Data Visualization on Dark Background
Analyzing Stock Market Trends with Dynamic Graphs and Data
Futuristic Green Light Waves on Black Background
Premium
Finger presses the withdraw button on a dark digital interface displaying neon financial charts
Abstract Circuit Brain with Financial Growth Concept
Line Graph Illustrating Data Trend on Green Digital Background
Digital Stock Market Graph Red Trendline on Green Background
Abstract Representation of Financial Data Processing
Premium
Water drop with a financial chart as background. The chart shows blue, red, and green lines. Water ripples give a sense of market movement and investment.
Dynamic Green Stock Market Chart with Upward Arrows
Digital DNA Strand Overlaid with Scientific Data Patterns
Digital Abstract Green Neon Waveforms on Black Background
Dynamic Financial Graph on Purple Background
Artificial Intelligence with Futuristic Digital Interface Design
Dynamic Financial Graph in Virtual Red Grid Background
Dynamic Data Analysis on Digital Graph, Technology Background
Digital Financial Data Graph Showcasing Market Trends
Digital Financial Graph on Green Background Showing Rising Trends
Futuristic Global Finance Chart with Rotating Globe Animation
Dynamic Digital Data Visualization with Dot Graph Design
Futuristic Financial Graph with Data Overlays in Blue Holographic Style
Premium
Financial growth chart with rising stock market data. Colorful trend line and candlestick graph for business analysis.
Digital Data Processing with Graph and Grid Technology Interface
Stagflation Concept with Digital Financial Graphs
Financial Data Graph Rendering Global Market Trends
Fluctuating Digital Stock Market Data Chart
Premium
Stock market candlestick chart with green and red bars and blue line graph showing percentage changes and trends for financial analysis isolated on white background
Digital Cardiograph on Black Background in Colorful Display
Line Graphs on Digital Background Show Financial Data Trends
Financial Data Processing with Green Digital Graph in Action
Financial Graph Analysis on Green Grid Background
Premium
Green stock market graph trending upward on dark blue background
Abstract Green Waves in Digital Motion Fantasy Scape
Glowing Blue Cardiograph on Black Background Interface
Abstract Digital Finance Chart Showing Fluctuating Graph Lines
Digital Sound Wave with Frequency Bars on Dark Blue Background
Premium
Global financial market data visualization with world map
Dynamic Stagflation Concept Displaying Economic Burdens
Abstract DNA Helix Digital Network
Digital Network Connections and Data Processing Illustrative Graphic
Digital Financial Data Display with Graph and Grid
Premium
City skyline with wind turbines and solar panels at sunset, financial stock market graph superimposed, symbolizing green economy
Explore More Free Stock Images