
- Home >
- Stock Photos >
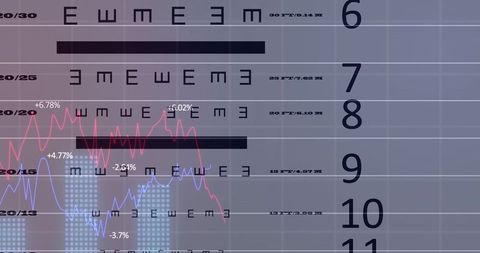
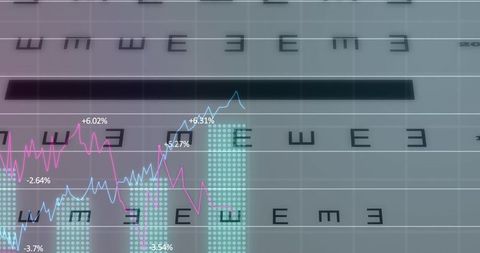
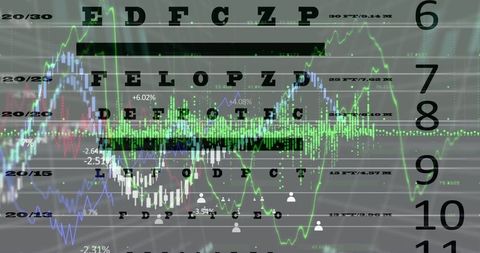
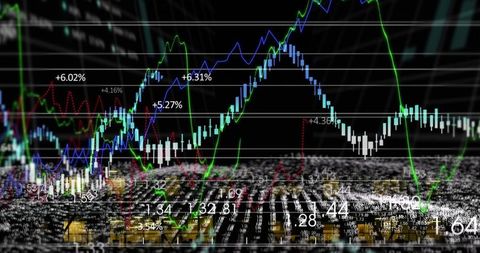
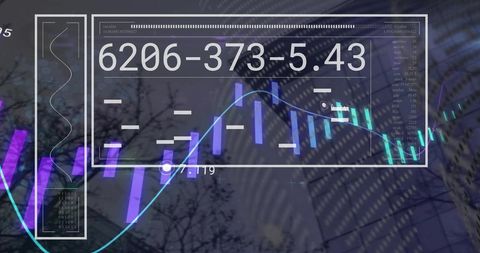
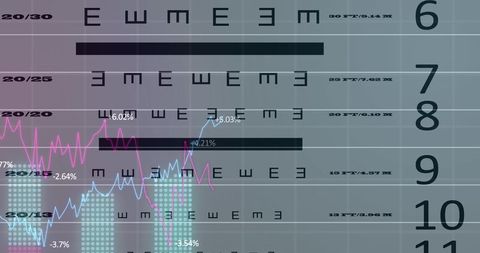
- Dynamic Financial Data Overlaying Eye Exam Chart Background
Dynamic Financial Data Overlaying Eye Exam Chart Background Image

The image combines stock market trends with an ophthalmic chart, creating a dynamic representation of the interconnectedness of financial data and visual perception. This conceptual blend highlights the meticulous analysis needed in finance and evokes a metaphor of clearly viewing market shifts. It is perfect for use in business presentations, financial reports, and articles that interpret market analytics or underscore the importance of clear financial vision in investments.
Powered by 


downloads
Tags:
More
Credit Photo
If you would like to credit the Photo, here are some ways you can do so
Text Link
photo Link
<span class="text-link">
<span>
<a target="_blank" href=https://pikwizard.com/photo/dynamic-financial-data-overlaying-eye-exam-chart-background/51383f499d8305bd7e005ec710a0affc/>PikWizard</a>
</span>
</span>
<span class="image-link">
<span
style="margin: 0 0 20px 0; display: inline-block; vertical-align: middle; width: 100%;"
>
<a
target="_blank"
href="https://pikwizard.com/photo/dynamic-financial-data-overlaying-eye-exam-chart-background/51383f499d8305bd7e005ec710a0affc/"
style="text-decoration: none; font-size: 10px; margin: 0;"
>
<img src="https://pikwizard.com/pw/medium/51383f499d8305bd7e005ec710a0affc.jpg" style="margin: 0; width: 100%;" alt="" />
<p style="font-size: 12px; margin: 0;">PikWizard</p>
</a>
</span>
</span>
Free (free of charge)
Free for personal and commercial use.
Author: People Creations
Similar Free Stock Images

Premium


Premium


Premium


Premium


Premium


Premium


Premium


Premium


Premium


Premium


Premium


Premium


Premium


Premium


Premium


Premium


Premium


Premium


Premium


Premium


Premium


Premium


Premium


Premium


Premium


Explore More Free Stock Images