- Home >
- Stock Photos >
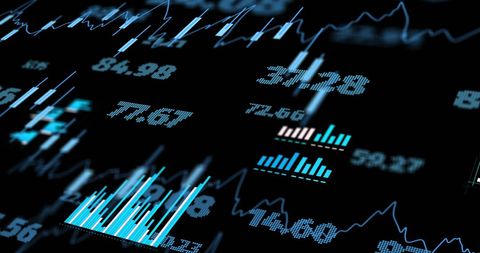
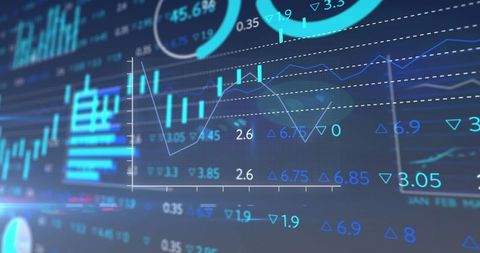
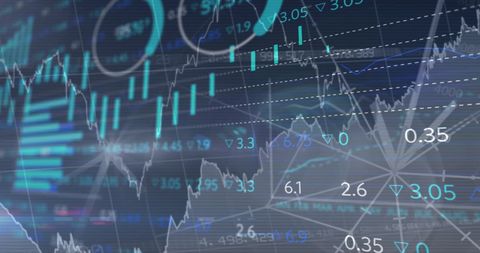
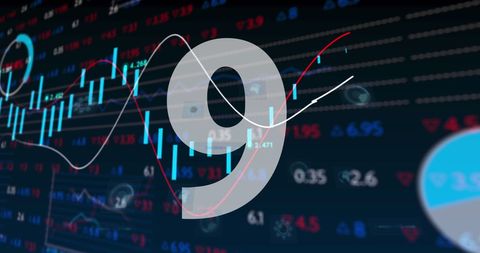
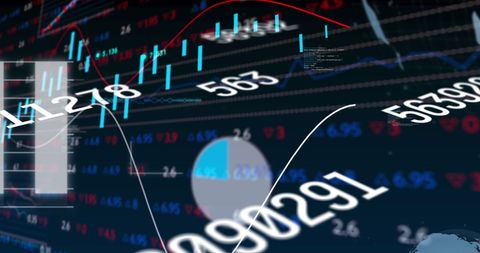
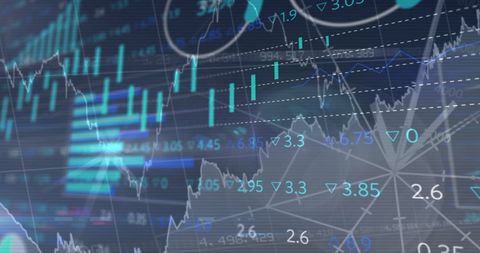
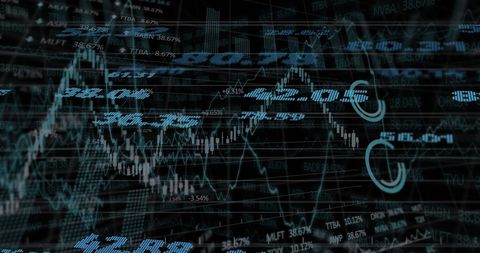
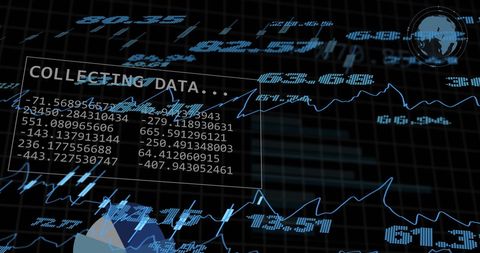
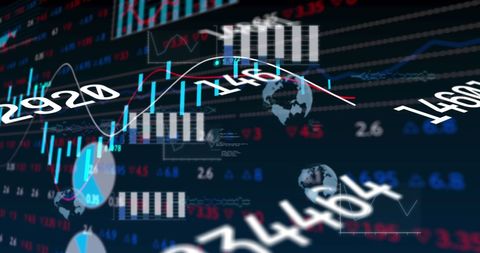
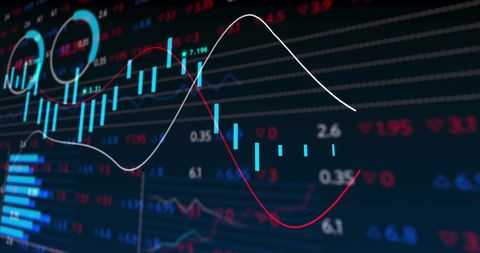
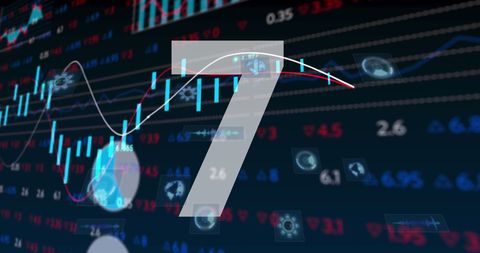
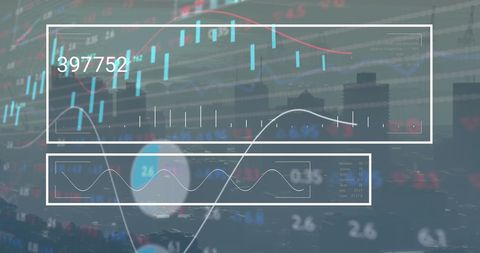
- Dynamic Financial Data Processing Display with Charts
Dynamic Financial Data Processing Display with Charts Image
Complex financial charts and graphs illustrate the dynamic nature of stock market trends. The combination of numbers and data processing represents concepts of trading, economic analysis, and digital finance models. Suitable for financial reports, economic publications, or fintech presentations.

downloads
Tags:
More
Credit Photo
If you would like to credit the Photo, here are some ways you can do so
Text Link
photo Link
<span class="text-link">
<span>
<a target="_blank" href=https://pikwizard.com/photo/dynamic-financial-data-processing-display-with-charts/d0f49be82ab39f33c12ceb6ab32dcbaf/>PikWizard</a>
</span>
</span>
<span class="image-link">
<span
style="margin: 0 0 20px 0; display: inline-block; vertical-align: middle; width: 100%;"
>
<a
target="_blank"
href="https://pikwizard.com/photo/dynamic-financial-data-processing-display-with-charts/d0f49be82ab39f33c12ceb6ab32dcbaf/"
style="text-decoration: none; font-size: 10px; margin: 0;"
>
<img src="https://pikwizard.com/pw/medium/d0f49be82ab39f33c12ceb6ab32dcbaf.jpg" style="margin: 0; width: 100%;" alt="" />
<p style="font-size: 12px; margin: 0;">PikWizard</p>
</a>
</span>
</span>
Free (free of charge)
Free for personal and commercial use.
Author: Awesome Content