
- Home >
- Stock Photos >
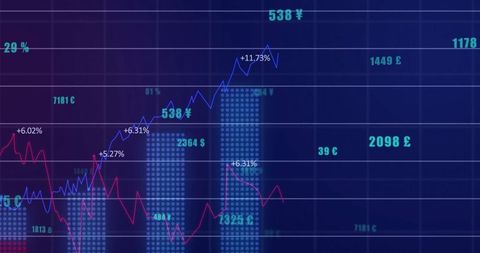
- Dynamic Financial Data Processing in Modern Analytics
Dynamic Financial Data Processing in Modern Analytics Image

Visual representation of financial data processing using colorful bar and line charts projected over a dark background signifies modern analytics tools used in business growth and decision-making. Perfect for illustrating concepts in finance, strategic analysis, and data-driven marketing strategies. Useful for presentations, articles, or blogs focused on technological advancements in the financial industry.
Powered by  - Get 15% off with code: PIKWIZARD15


downloads
Tags:
More
Credit Photo
If you would like to credit the Photo, here are some ways you can do so
Text Link
photo Link
<span class="text-link">
<span>
<a target="_blank" href=https://pikwizard.com/photo/dynamic-financial-data-processing-in-modern-analytics/9ef9e57b59ddeafc35b4c406a633cb88/>PikWizard</a>
</span>
</span>
<span class="image-link">
<span
style="margin: 0 0 20px 0; display: inline-block; vertical-align: middle; width: 100%;"
>
<a
target="_blank"
href="https://pikwizard.com/photo/dynamic-financial-data-processing-in-modern-analytics/9ef9e57b59ddeafc35b4c406a633cb88/"
style="text-decoration: none; font-size: 10px; margin: 0;"
>
<img src="https://pikwizard.com/pw/medium/9ef9e57b59ddeafc35b4c406a633cb88.jpg" style="margin: 0; width: 100%;" alt="" />
<p style="font-size: 12px; margin: 0;">PikWizard</p>
</a>
</span>
</span>
Free (free of charge)
Free for personal and commercial use.
Author: Creative Art
Similar Free Stock Images

Premium


Premium


Premium


Premium

Premium

Premium


Premium


Premium


Premium


Premium

Premium

Premium


Premium


Premium


Premium

Premium

Premium


Premium


Premium


Premium

Premium


Premium


Premium

Premium

Premium


Explore More Free Stock Images