
- Home >
- Stock Photos >
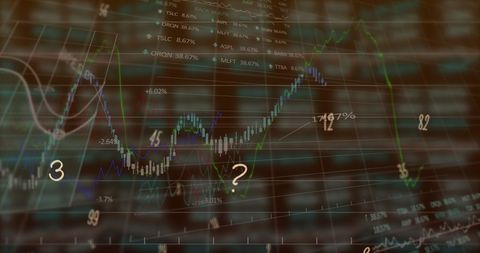
- Dynamic Financial Data Processing with Global Networks Interface
Dynamic Financial Data Processing with Global Networks Interface Image

This image showcases electronic financial data screens with dynamic numbers and graphs, representing stock market trends and global networks. Ideal for use in finance-related presentations, articles about investment strategies, financial technology websites, or advertisements for data analysis software.
Powered by  - Get 15% off with code: PIKWIZARD15


downloads
Tags:
More
Credit Photo
If you would like to credit the Photo, here are some ways you can do so
Text Link
photo Link
<span class="text-link">
<span>
<a target="_blank" href=https://pikwizard.com/photo/dynamic-financial-data-processing-with-global-networks-interface/a1b67463eb0393d16b870b9b3cd3b600/>PikWizard</a>
</span>
</span>
<span class="image-link">
<span
style="margin: 0 0 20px 0; display: inline-block; vertical-align: middle; width: 100%;"
>
<a
target="_blank"
href="https://pikwizard.com/photo/dynamic-financial-data-processing-with-global-networks-interface/a1b67463eb0393d16b870b9b3cd3b600/"
style="text-decoration: none; font-size: 10px; margin: 0;"
>
<img src="https://pikwizard.com/pw/medium/a1b67463eb0393d16b870b9b3cd3b600.jpg" style="margin: 0; width: 100%;" alt="" />
<p style="font-size: 12px; margin: 0;">PikWizard</p>
</a>
</span>
</span>
Free (free of charge)
Free for personal and commercial use.
Author: Authentic Images
Similar Free Stock Images

Premium


Premium


Premium


Premium


Premium


Premium

Premium

Premium


Premium


Premium


Premium

Premium


Premium

Premium


Premium

Premium

Premium


Premium


Premium


Premium


Premium


Premium


Premium


Premium


Premium


Explore More Free Stock Images