
- Home >
- Stock Photos >
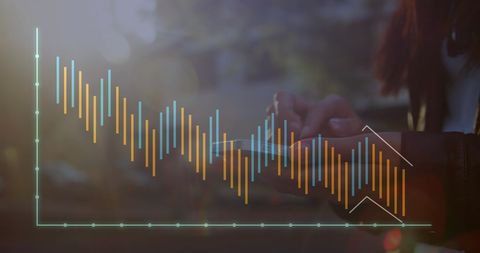
- Dynamic Financial Data Processing with Graph Movement
Dynamic Financial Data Processing with Graph Movement Image

Graph with varying bars represents dynamic financial operations. Useful for illustrating concepts of data analysis, financial trends, stock market variations, and digital connectivity in financial services.
Powered by  - Get 15% off with code: PIKWIZARD15


downloads
Tags:
More
Credit Photo
If you would like to credit the Photo, here are some ways you can do so
Text Link
photo Link
<span class="text-link">
<span>
<a target="_blank" href=https://pikwizard.com/photo/dynamic-financial-data-processing-with-graph-movement/509858ed5f90a191ba4910ffe91ec87b/>PikWizard</a>
</span>
</span>
<span class="image-link">
<span
style="margin: 0 0 20px 0; display: inline-block; vertical-align: middle; width: 100%;"
>
<a
target="_blank"
href="https://pikwizard.com/photo/dynamic-financial-data-processing-with-graph-movement/509858ed5f90a191ba4910ffe91ec87b/"
style="text-decoration: none; font-size: 10px; margin: 0;"
>
<img src="https://pikwizard.com/pw/medium/509858ed5f90a191ba4910ffe91ec87b.jpg" style="margin: 0; width: 100%;" alt="" />
<p style="font-size: 12px; margin: 0;">PikWizard</p>
</a>
</span>
</span>
Free (free of charge)
Free for personal and commercial use.
Author: Creative Art
Similar Free Stock Images

Premium


Premium

Premium


Premium


Premium


Premium


Premium


Premium

Premium

Premium


Premium

Premium


Premium


Premium


Premium

Premium


Premium

Premium

Premium


Premium

Premium


Premium


Premium

Premium


Premium


Explore More Free Stock Images