- Home >
- Stock Photos >
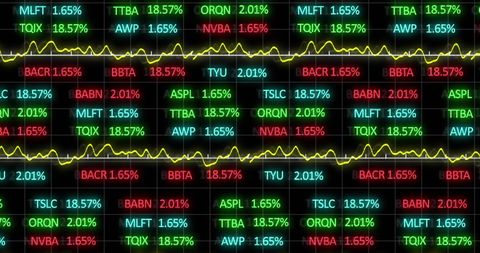
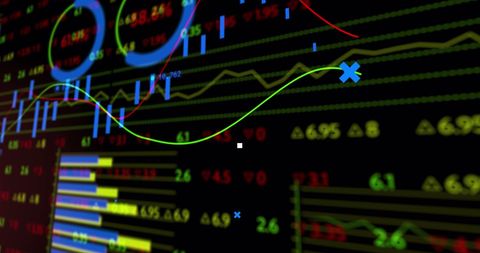
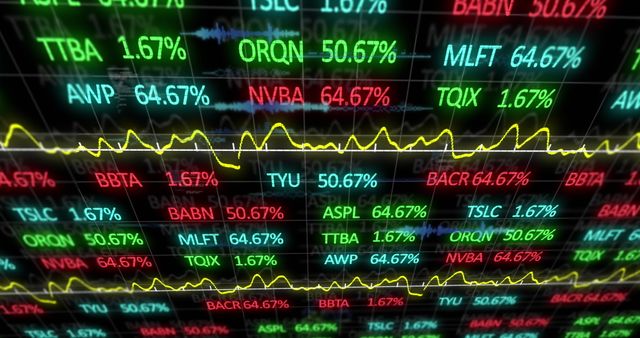
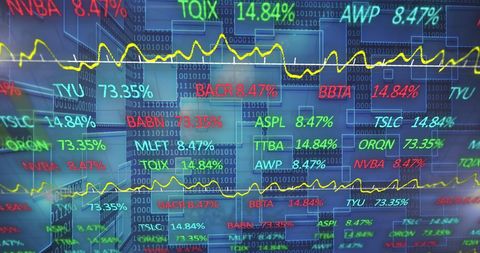
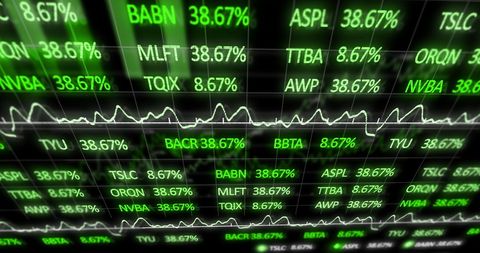
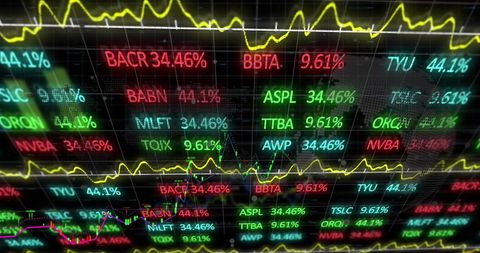
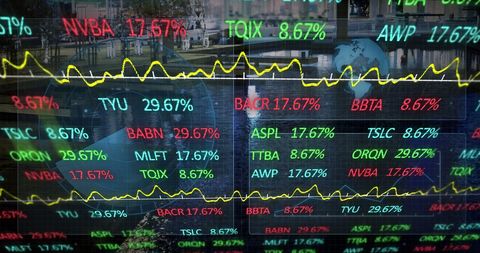
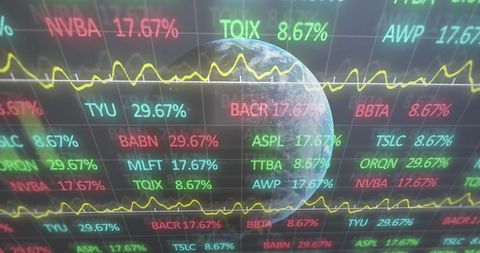
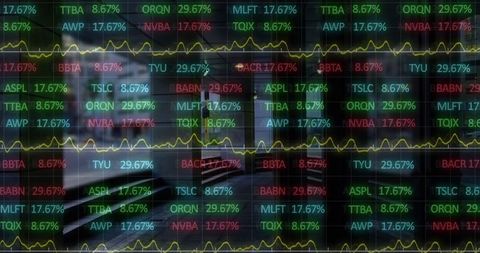
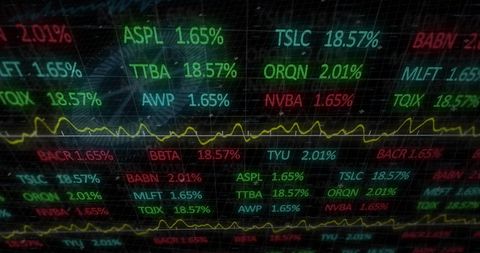
- Dynamic Financial Data Processing with Graphical Indicators
Dynamic Financial Data Processing with Graphical Indicators Image
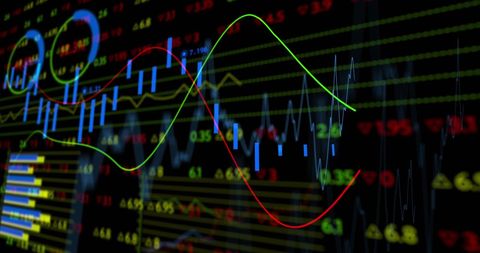
Illustrating complex financial data and processing with colorful graphs and numbers over a black background. Perfect for showcasing concepts related to global business networks, financial analyses, and modern data computation. Ideal for use in presentations, educational materials, and marketing relating to finance and technology sectors.

downloads
Tags:
More
Credit Photo
If you would like to credit the Photo, here are some ways you can do so
Text Link
photo Link
<span class="text-link">
<span>
<a target="_blank" href=https://pikwizard.com/photo/dynamic-financial-data-processing-with-graphical-indicators/fa59e4d38c5c03aee4edb986508eda4b/>PikWizard</a>
</span>
</span>
<span class="image-link">
<span
style="margin: 0 0 20px 0; display: inline-block; vertical-align: middle; width: 100%;"
>
<a
target="_blank"
href="https://pikwizard.com/photo/dynamic-financial-data-processing-with-graphical-indicators/fa59e4d38c5c03aee4edb986508eda4b/"
style="text-decoration: none; font-size: 10px; margin: 0;"
>
<img src="https://pikwizard.com/pw/medium/fa59e4d38c5c03aee4edb986508eda4b.jpg" style="margin: 0; width: 100%;" alt="" />
<p style="font-size: 12px; margin: 0;">PikWizard</p>
</a>
</span>
</span>
Free (free of charge)
Free for personal and commercial use.
Author: Authentic Images