- Home >
- Stock Photos >
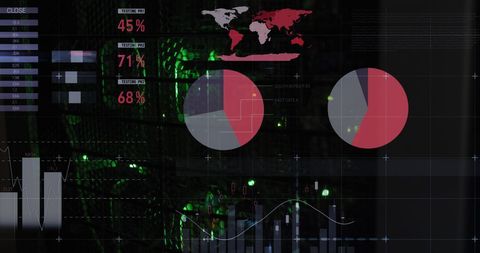
- Dynamic Financial Data Processing with Red Pie Chart Representation
Dynamic Financial Data Processing with Red Pie Chart Representation Image

Illustrates global finance trends with a red pie chart mixing with market graphs and data points over dark background. Ideal for financial reports, business presentations, or educational purposes highlighting economic concepts and data-driven decisions.

downloads
Tags:
More
Credit Photo
If you would like to credit the Photo, here are some ways you can do so
Text Link
photo Link
<span class="text-link">
<span>
<a target="_blank" href=https://pikwizard.com/photo/dynamic-financial-data-processing-with-red-pie-chart-representation/ff0c8d5c7c543f21c99fcf3abb1bc5c4/>PikWizard</a>
</span>
</span>
<span class="image-link">
<span
style="margin: 0 0 20px 0; display: inline-block; vertical-align: middle; width: 100%;"
>
<a
target="_blank"
href="https://pikwizard.com/photo/dynamic-financial-data-processing-with-red-pie-chart-representation/ff0c8d5c7c543f21c99fcf3abb1bc5c4/"
style="text-decoration: none; font-size: 10px; margin: 0;"
>
<img src="https://pikwizard.com/pw/medium/ff0c8d5c7c543f21c99fcf3abb1bc5c4.jpg" style="margin: 0; width: 100%;" alt="" />
<p style="font-size: 12px; margin: 0;">PikWizard</p>
</a>
</span>
</span>
Free (free of charge)
Free for personal and commercial use.
Author: Awesome Content